So, in my earlier posts, you’ve learned that supports and resistances get weaker at every new touch, some of them work better if we don’t wait for a confirmation candle, and that the way the price approaches the support level is crucial to identify the need or not for a confirmation.
After that, we discussed support and resistances formed from a single peak, and how supports and resistances from higher time frames have the potential to give us really big risk/reward trades, and at the same time tend to work better with aggressive entries.
In case you missed the lessons, here are the links:
Why your supports and resistances fail
A new way to trade supports and resistances
Now:
There’s much more to talk about that.
So I decided to put on one more class.
Today you’ll discover:
1 – How to avoid supports and resistances that are there just to be broken
2 – How to spot hidden supports and resistances
Are you ready?
Then, let’s get started…
How to avoid supports and resistances that are there just to be broken
Some traders love to fill their charts with lines.
They open their trading time frame.
And start using the horizontal line as if there’s no tomorrow.
If I asked them to draw supports and resistances, they would do something like this:
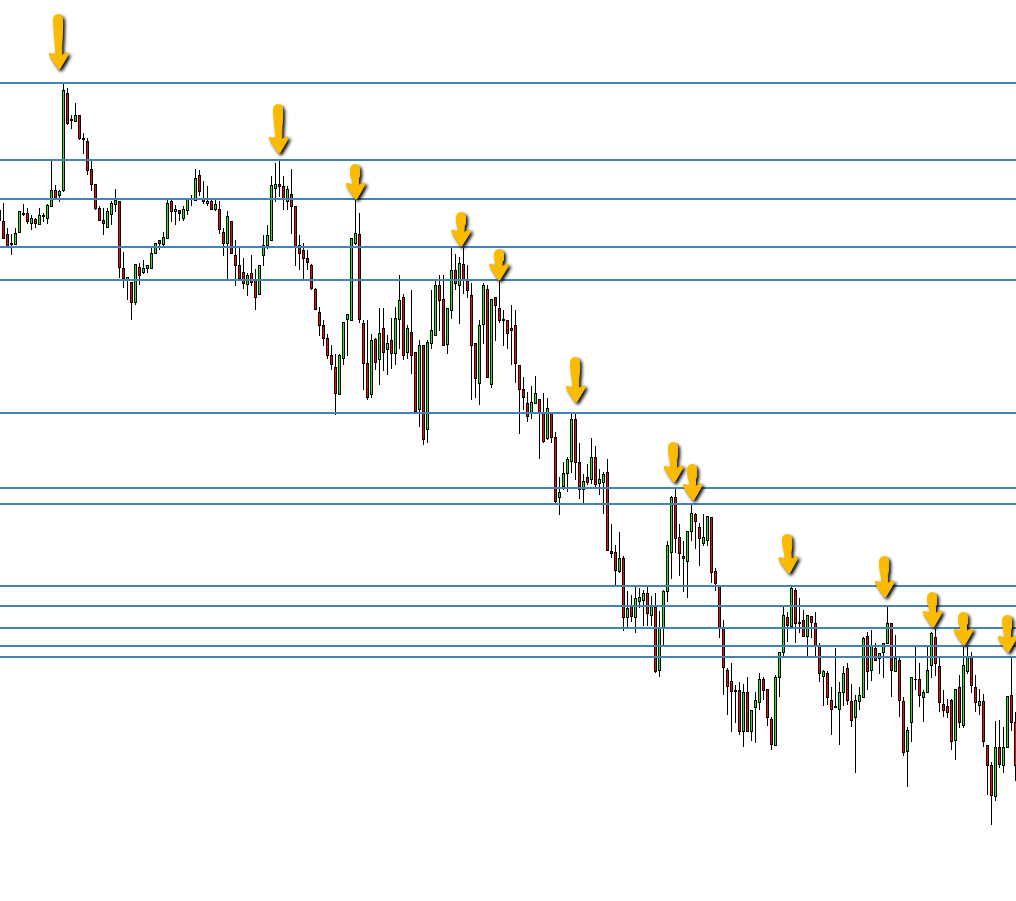
And then they do crazy things like…
Waiting for the price to start going up, and shorting every time a line is touched.
Hoping that one of them will work and give them a good profit.
And the result is…
Not pretty…
Here’s what happened next in our example:
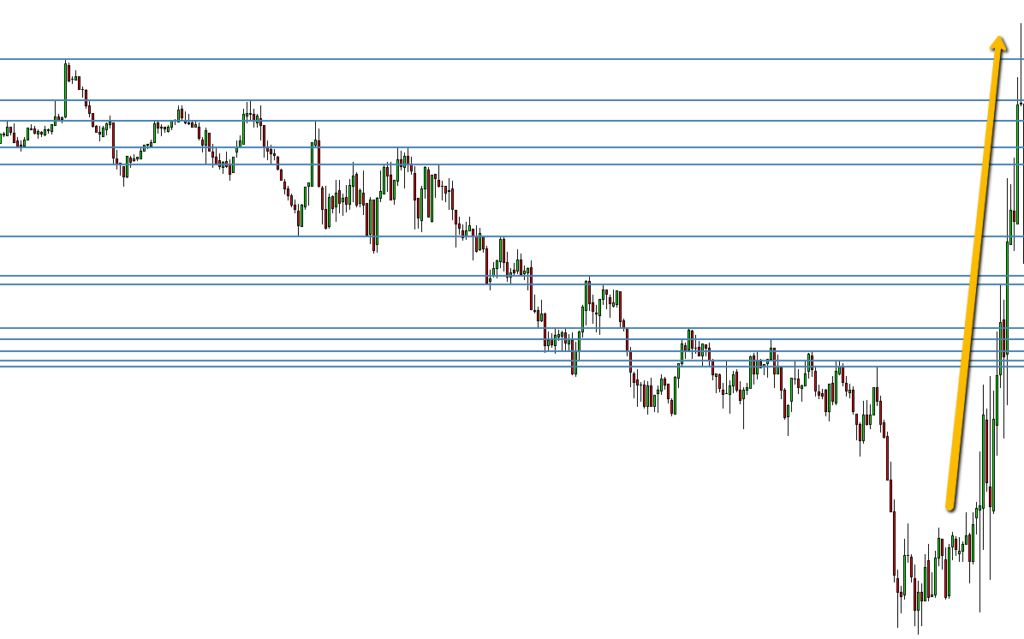
The price made one last drop, and then it broke all resistances at once.
Shure that a couple of them created some kind of reaction.
But getting 2 small profits and 10 losses or more…
It doesn’t seem that it will work well in the long term.
You know, when you see a lot of resistances so close to each other.
It means that short sellers are split between all of them.
Their strength is not concentrated.
Imagine this…
We have two sports teams.
Any sport that you like, football, basketball,… as long as it’s played in a group.
Team A has top players.
All of them have great skills but they lack something, they always try to play alone.
Every time that they get the ball they try to go from one side of the field to score on the other side.
They do this alone, without ever passing the ball to the other team members.
Team B on the other hand, has medium-quality players.
They don’t have skills as good as team A, but they have something that differentiates them.
They are smart, they play as a team.
When the opponent comes to them, they create a wall altogether, and no one is able to pass them.
When they are attacking, they move all together and pass the ball to each other to avoid the opponent.
Now I ask you…
Which team would you bet on?
The team that works as a team, will tend to be much more powerful than the one with individuals working by themselves.
When you are drawing the supports and resistances on your charts, you are a player of the game.
You want to go to where the bulk of the team is.
Waiting to start a move against the whole opposite team.
Smart traders know that the biggest liquidity is on extremes.
And that’s where you want to be when you want to score big.
You wait for the price to reach an extreme, and you make your offensive move there.
The extreme resistance in our example also happened to be the high of the day.
Here’s what happened there:
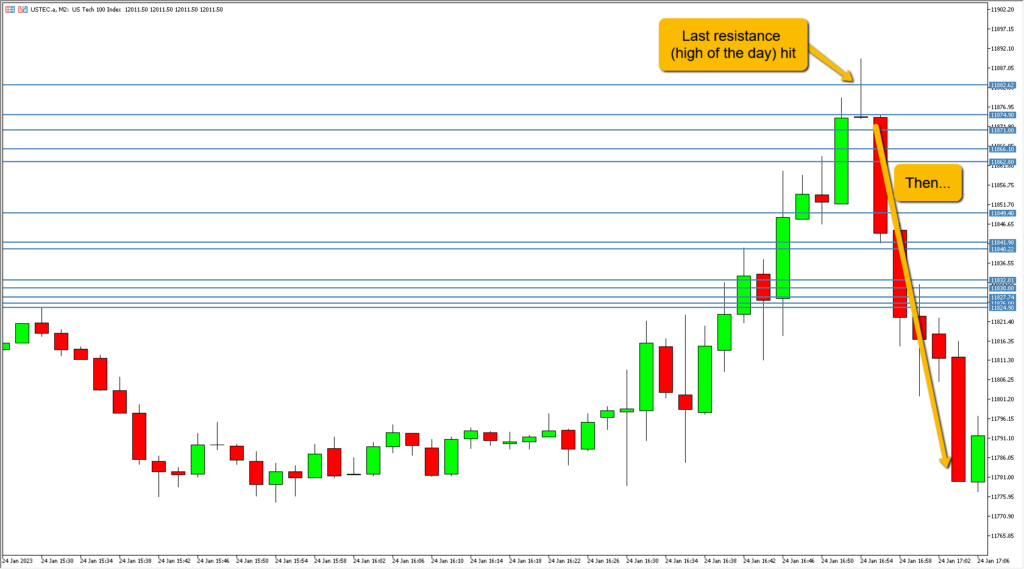
Beautiful move to the downside.
Do you know what was created at the high after the move to the downside?
A new resistance, yeah!
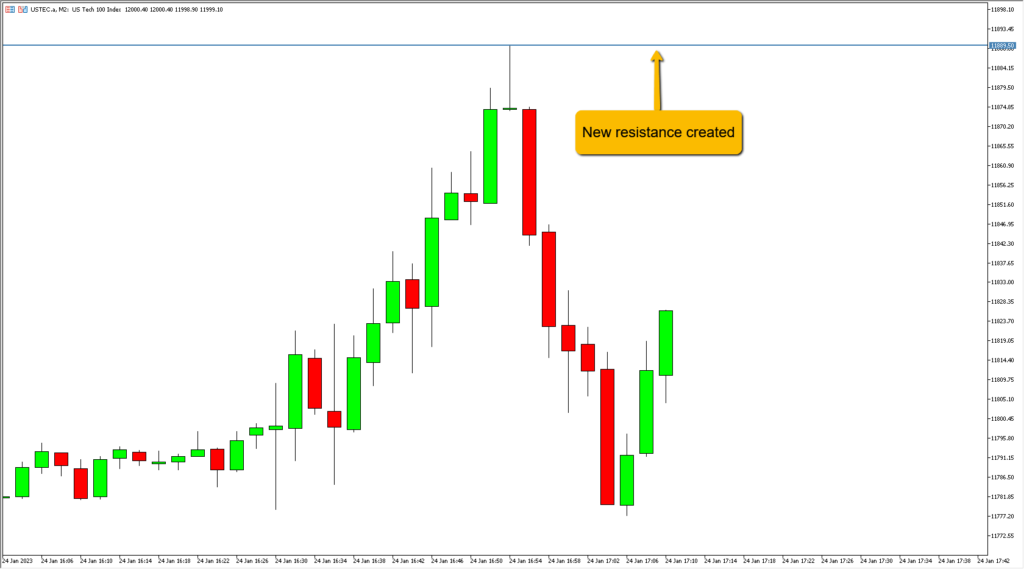
Now, let’s wait for the resistance to be hit to short again.
Ok?
I have to tell you…
If you’re waiting for that line to be hit.
You’ll be disappointed.
Want to know why?
There’s a hidden resistance there now.
Let’s learn…
How to spot hidden supports and resistances
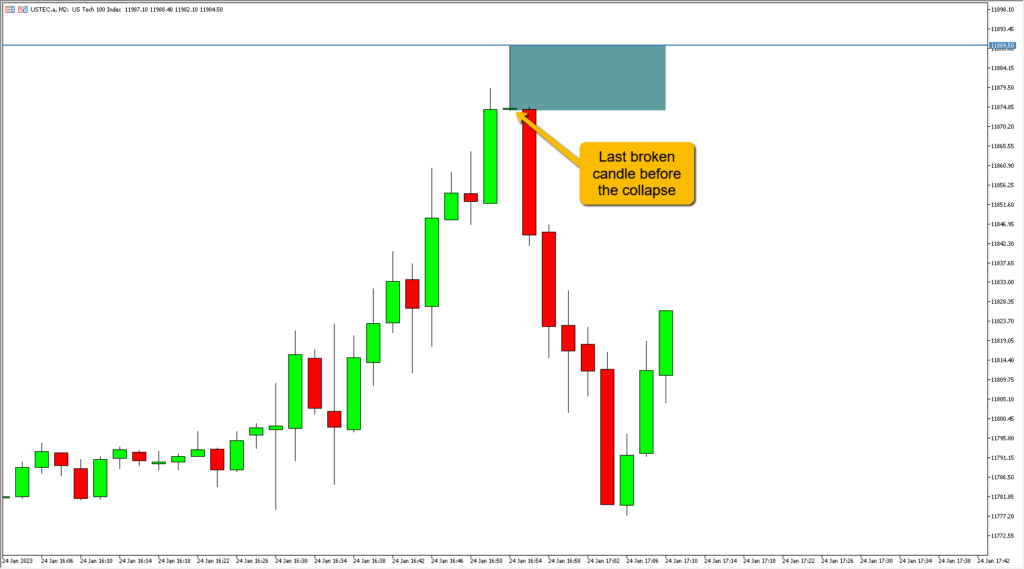
Hidden resistances are created when the price changes the trend and moves vertically, very fast.
It’s not the typical smooth 45º move, with impulses and pullbacks.
It’s a really strong move, without ever going back.
When you’re able to spot these kinds of moves, you’re also able to spot the hidden support and resistance zones.
Instead of lines, we use rectangles to draw them.
Just watch where was the last broken candle before the big move started, and use that level to draw the bottom of your rectangle.
The top can be the last high.
Like this:
Now that you have that rectangle, you’re NOT waiting for the line at the top to be hit.
Instead…
You’re waiting for the rectangle to be hit.
And this is what happens:
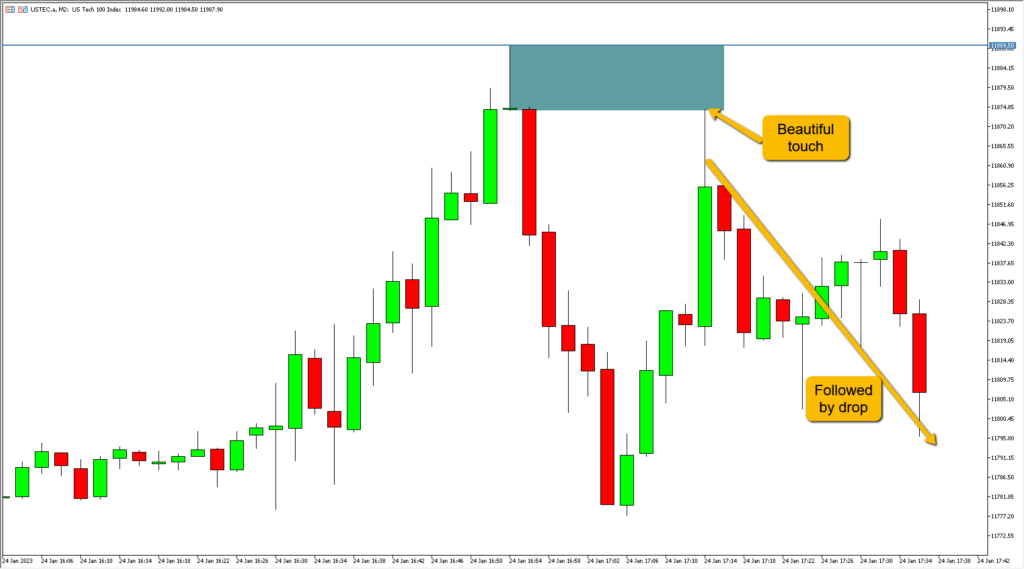
These kinds of hidden supports and resistances frustrate a lot of traders.
Either because they are waiting to short at the resistance line.
Or even worse…
They are long and aiming for the resistance line to close their trades, just to see the price coming all the way back to them.
Giving them a loss.
So, right now…
You’ve learned several support and resistance hacks that work.
With this knowledge, you can be a better trader.
You can time and target your entries and exit with more precision.
Of course, there’s much more to learn if you want to improve your trading performance.
Much more than what would fit on a blog post or website page.
That’s why I’m opening the doors to my Flash Trading Program before I close the enrolment again.
It’s the perfect fit for you if you like high-quality sniper entries and exits for your trades.
So, if you want to join, just wait for my next email.