
What is Fibonacci trading?
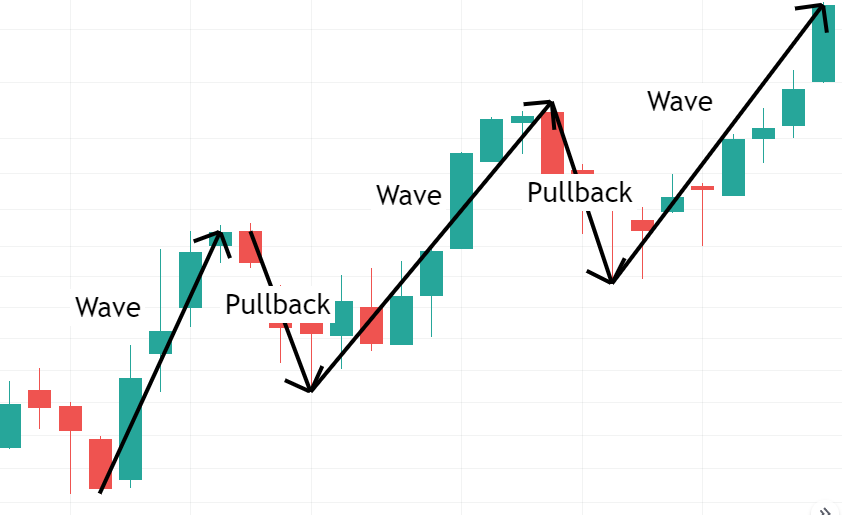
Markets tend to move in waves and pullbacks (retracements).
On an uptrend, we have big waves to the upside and smaller retracements to the downside.
The opposite for a downtrend.
Here’s an example of a move on an uptrend:
Simple right?
Notice that the pullbacks or retracements always dive inside the previous wave.
Fibonacci trading is a way of using probabilities to try to “guess” where will the retracement stop to start a new wave again.
That would be our entry signal.
But it doesn’t stop here.
After that, Fibonacci trading can also be used to try to know where will the next wave stop before a new retracement starts again.
That would be called the extension.
Let’s dive into these waves and learn how to trade using Fibonacci retracements and extensions.
The magic sequence of Fibonacci numbers
Fibonacci trading uses the Fibonacci sequence of numbers.
How do we get these Fibonacci numbers?
Simple.
The Fibonacci sequence is formed by adding the previous two numbers to get the next one.
It starts with 0 and 1.
Then we add them:
0 + 1 = 1
Our sequence is now: 0, 1, 1.
Then we add again the last two numbers:
1 + 1 = 2
Our sequence is now 0, 1, 1, 2.
As we keep adding the last two numbers our sequence gains this shape:
0, 1, 1, 2, 3, 5, 8, 13, 21, 34, 55, 89, 144, 233, and so on.
Now you’re asking…
What do I do with these Fibonacci numbers?
The key Fibonacci levels that you want to use to trade
The numbers from the Fibonacci sequence are used to calculate the magic Fibonacci key levels.
Here’s how…
The 61.8% Fibonacci level
Fibonacci found that each number of the sequence is about 61.8% smaller than the next number of the sequence.
If we pick a number and divide it by the next one, we get the 61.8% number, used as a Fibonacci retracement level.
Examples:
55 / 89 = 0.618 x 100 = 61.8%
89 / 144 = 0.618 x 100 = 61.8%
The 38.2% Fibonacci level
This Fibonacci level comes from the relation between a number of the sequence and the number that is two steps ahead.
Let’s pick a part of the sequence:
“… 55, 89, 144, …”
Now we divide the first by the third.
And we get 55 / 144 = 0.382 x 100 = 38.2%
The 23.6% Fibonacci level
To get this Fibonacci level, we are using a number of the sequence and the one that it’s two steps ahead.
Let’s pick another part of the sequence as an example:
“… 13, 21, 34, 55, …”
Now we divide the first by the fourth.
13 / 55 = 0.236 x 100 = 23.6%
Nice findings, right?
All Fibonacci levels
Besides the levels that we saw above, Fibonacci trading also uses two more levels.
One is 78.6%, which is the square root of 61.8%.
And the other is the 50% level, used as a convention but still important.
Resuming, the key Fibonacci levels that are used to trade are:
23.6%, 38.2%, 50%, 61.8% and 78.6%.
Now, let’s apply these levels to wave retracements and extensions.
What is a Fibonacci retracement?
A Fibonacci retracement tells us how deep a pullback went into the previous wave before it started a new wave again.
A Fibonacci retracement is measured in percentages.
Basically, it tells us how much percentage of the wave was erased by the pullback.
Look at this example:
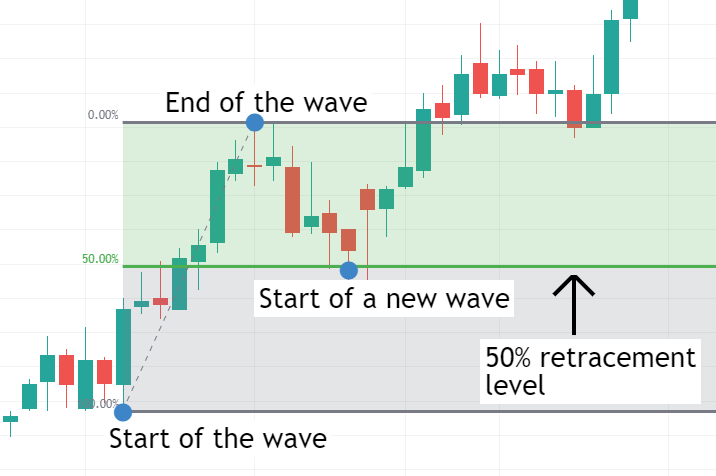
We can clearly see that after the wave to the upside, the price made a pullback that retraced inside the previous wave by about 50%.
And then it started a new wave again.
The deeper the pullback goes into the wave, the bigger the percentage of the Fibonacci retracement.
A 100% Fibonacci retracement would mean that the price got back to the origin of the wave again.
Got it?
Let’s move on to extensions now.
What is a Fibonacci extension?
A Fibonacci extension tells us how big was the second wave compared to the previous one.
Similar to the retracements, Fibonacci extensions are also measured in percentages.
A 100% Fibonacci extension would mean that the second wave had the same size as the first one.
Let’s look at our example again, now with the Fibonacci extension levels:
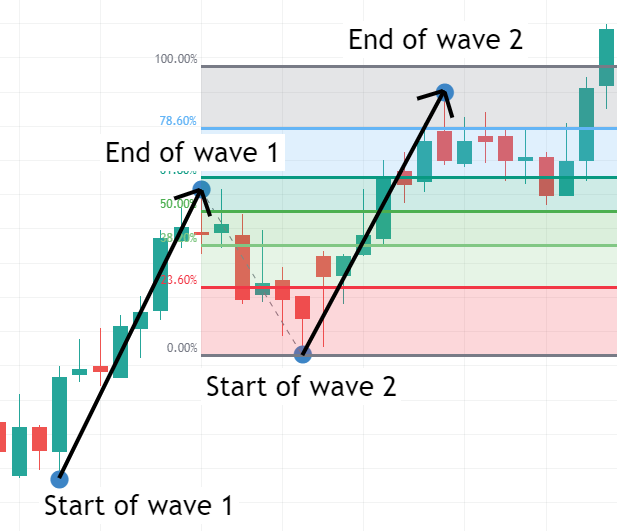
We can see that the price turned back after hitting about the 90% Fibonacci extension level.
Meaning that the second wave size was about 90% of the first wave size.
A pullback appearing before the 100% Fibonacci extension level means that the second wave was smaller than the first one.
On the other hand, a pullback appearing after the 100% Fibonacci extension level means that the second wave was bigger than the first one.
Pretty simple right?
Fibonacci Retracement vs Fibonacci Extension
A Fibonacci retracement tells us how much percentage of the first wave was deleted by the pullback.
It’s mainly used to find entries to trade.
A Fibonacci extension tells us how big was the second wave compared with the first one.
Fibonacci extensions are typically used to find targets to close trades.
Let’s now learn how to draw them and then how to trade with Fibonacci retracements and extensions.
How to draw Fibonacci Retracements
You need 2 points to draw a Fibonacci retracement:
Point 1 – The start of the Impulse
Point 2 – The end of the Impulse
Here’s how to do it on Tradingview.
If you use a different platform the steps should be pretty much similar to the TradingView Fibonacci retracement tool.
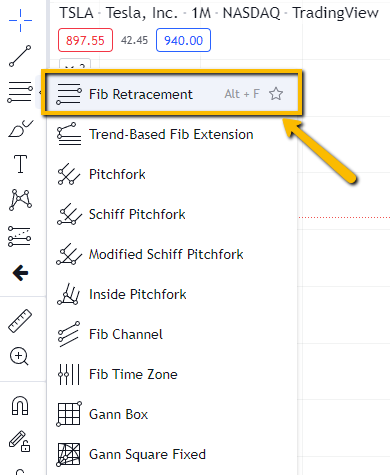
How to draw Fibonacci Retracement in TradingView
Find the Gann and Fibonacci Tools menu.
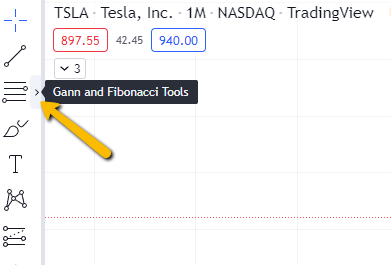
Click on the first result, “Fib Retracement”.
Now you just need to pick your two points.
You always pick them from left to right.
Meaning that if the move was up, the first point to calculate the Fibonacci retracement will be lower than the second.
If the move was down, the first point to calculate the Fibonacci retracement will be higher than the second.
Here’s an example considering a move to the upside.
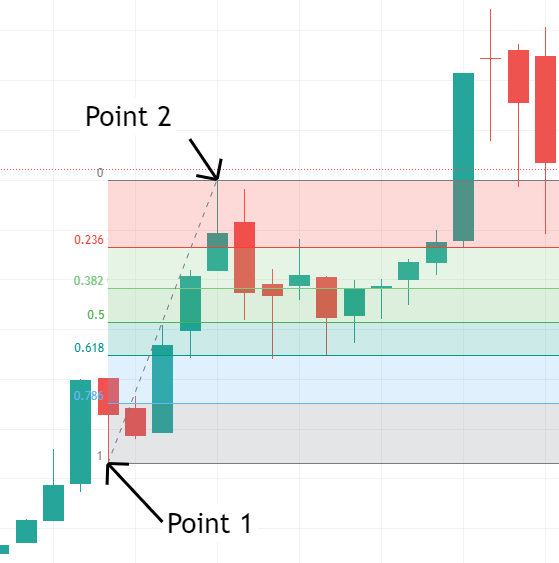
Now you have different zones with different colors matching the different Fibonacci retracement levels.
If you want to add/remove some particular levels you can easily do it by going to the settings of TradingView’s Fibonacci retracement tool.
The Fibonacci levels may appear as a decimal number instead of a percentage (which you can configure too).
Basically, it’s the same thing, you just need to multiply them by 100.
Example: The 0.382 level is the same as the 0.382 x 100 = 38.2% Fibonacci retracement level.
How to draw Fibonacci Extensions
You need 3 points to draw a Fibonacci extension:
Point 1 – The start of the Impulse
Point 2 – The end of the Impulse
Point 3 – The end of the Retracement
Here’s how to do it on Tradingview.
If you use a different platform the steps should be pretty much similar to the TradingView’s Fibonacci extension tool.
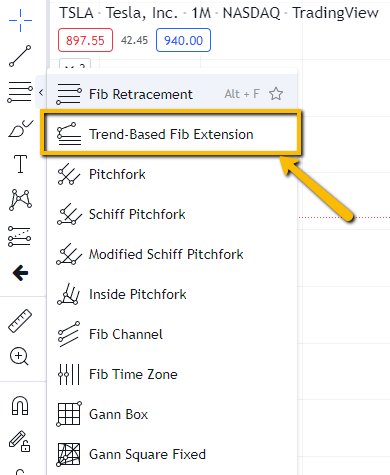
How to draw Fibonacci Extension in TradingView
Find the Gann and Fibonacci Tools menu.
Click on the second result, “Trend-Based Fib Extension”.
Now we need to pick our three points.
The same as with the retracement tool, we always pick the three points from left to right.
The first one is the start of the leg, the second one is the end of the leg, and the third one is the end of the retracement.
It should look like this:
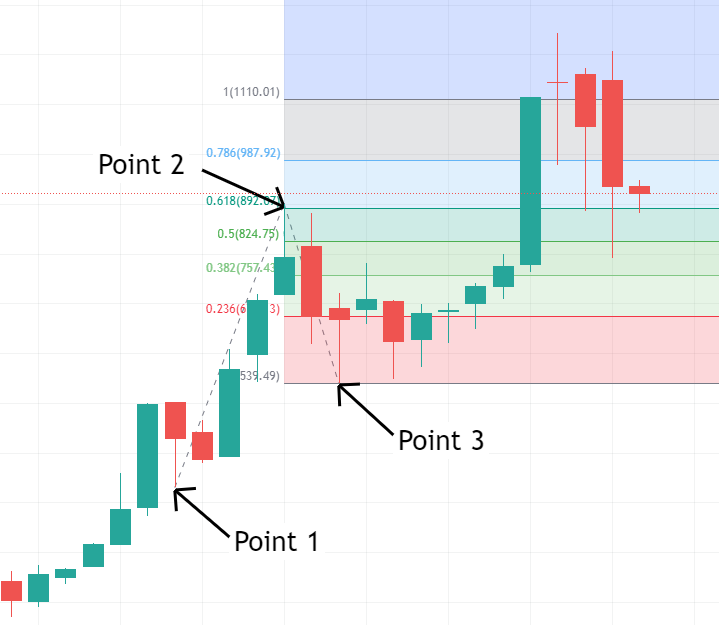
Now you should be able to see the different Fibonacci Extension levels.
You can easily add/remove levels that you want to see on your charts by going to the settings of the TradingView’s Fibonacci Extension tool.
Fibonacci trading strategy
Right, now we already know how to draw Fibonacci retracements and extensions.
We also know what are the Fibonacci levels used to trade.
Let’s dive into trading with Fibonacci.
Step #1 – Draw the Fibonacci retracement levels when a pullback starts
One of the most important rules regarding trading is to never try to chase the price.
Having the patience to wait for the price to come to our entry zone is key.
Now, I want you to look into your charts.
Is the price running?
Just broke a previous high or low?
In that case, just stay away, forget about it for now.
Is the price making a pullback after a rally or drop?
Ok, now you can start paying attention.
Identify the wave before the pullback.
Draw your Fibonacci levels and go to the next step.
Step #2 – Analyze the current market conditions
Depending on the market conditions, some levels will tend to work better than others.
Here are the three scenarios that you want to know how to identify.
Fast trend
A fast trend will typically produce a quick pullback before the price returns to the original trend.
This pullback will tend to appear in the 23.6-38.2% zone.
Look at this example:
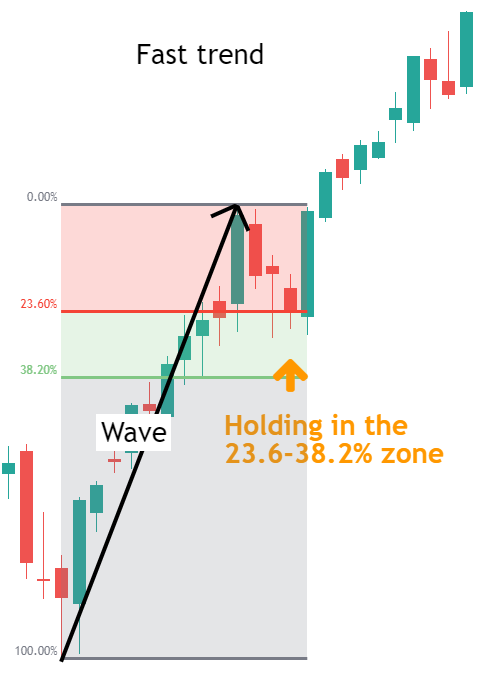
Keep in mind that fast trends are usually short-lived.
Don’t expect more than one or two successful and consecutive pullbacks on that 23.6-38.2% zone.
After that, the price will tend to make bigger pullbacks, diving more into the wave.
Sustainable trend
This type of trend is my favorite.
When we are trading a sustainable trend, a pullback to the 50-61.8% zone is the most common.
Here’s an example:
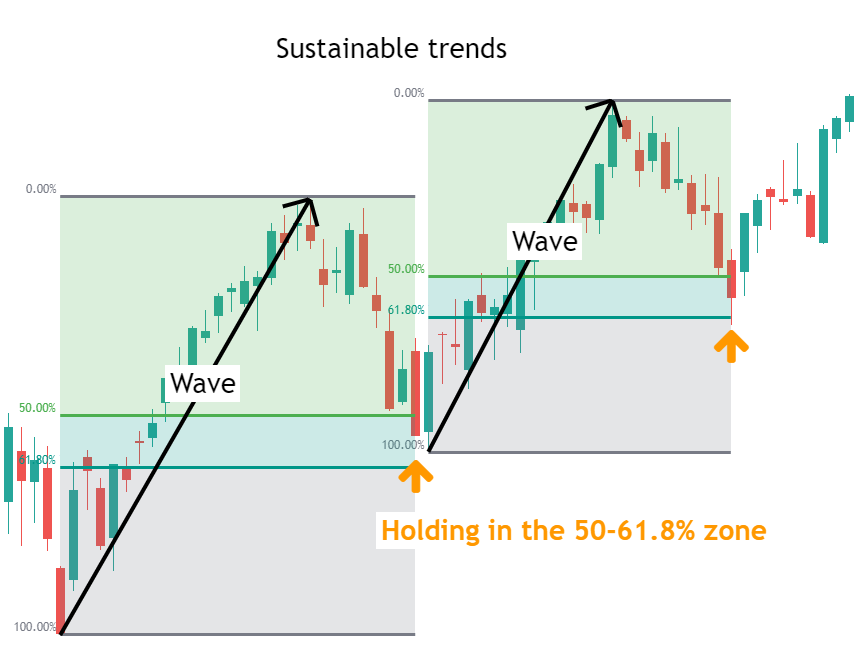
These kinds of pullbacks will tend to repeat more times than the fast trend’s pullbacks.
We can say that the 50-61.8% levels zone is the scenario that will tend to produce the best returns and bigger accuracy.
Sideways markets
When trading sideways markets, the retracements tend to be bigger than when a market is trending strongly.
For this reason, the smaller retracement levels should be avoided.
The 78.6% tends to work pretty well on ranging markets.
Here’s an example:
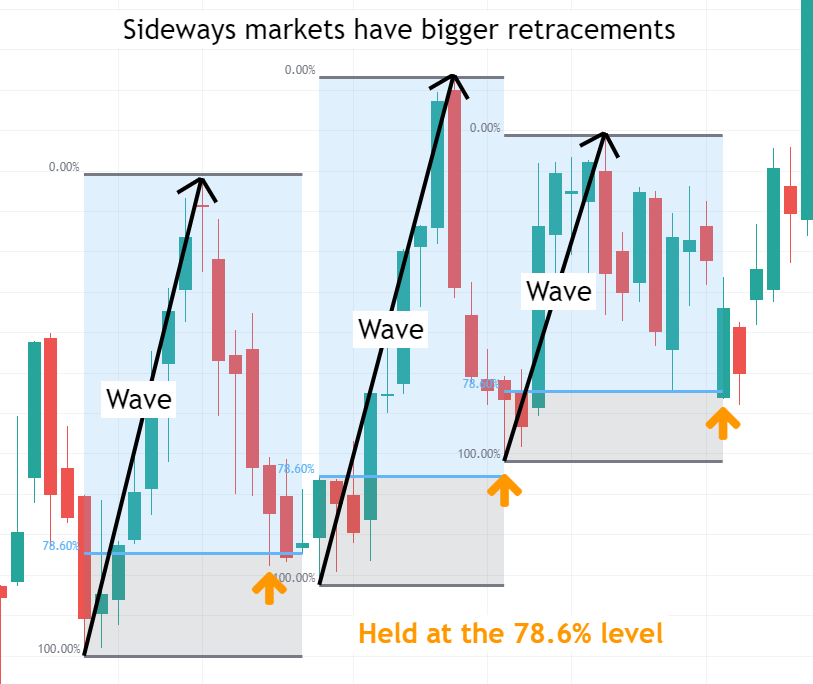
When the market breaks a sideways range and starts to trend, pullbacks to smaller retracement levels will tend to work better.
Step #3 – Open your trade
Here you have two different options.
You can trade it aggressively or conservatively.
Aggressive entry: You open your trade as soon as the price starts to enter the level’s zone that you are trading.
A stop loss on the other side of the zone is a good way to protect yourself in case things don’t work out.
Conservative entry: You wait for a rejection from the zone that you are trading.
This rejection can be a price action pattern, like a pinbar or an engulfing candle.
For the stop-loss, you can still use the other side of the zone, similar to the aggressive entry.
Alternatively, for tighter stop-losses, you can use the other side of the pattern.
Meaning that if the price deletes the pinbar or engulfing candle, you get out of the trade.
Pro tip
Since fast trend’s pullbacks appear fewer times, a conservative entry approach will tend to work better.
Step #4 – Set your targets
Now we want to know where to close our trade.
Depending on the scenario that we are trading, a different close approach may be more suitable.
Closing using Fibonacci extensions
Fibonacci extensions are a great help to give us a possible target.
When trading fast and sustainable trends, targeting an 80-100% extension is a good option.
The price will typically make moves similar to the previous wave.
When trading sideways markets, smaller extensions tend to work better.
Something around 50% is a good option.
Why?
Because sideways markets will not touch new highs/lows as often as trending markets.
They will tend to move within a range.
Getting out close to the other side of the range, but still inside the range, tends to produce the best results.
Closing using a minimum risk/reward ratio
A good risk/reward is key to saving our mental health.
No one likes to see the profit from several trades being wiped out from a single loss.
For this reason, a minimum of 1-1 risk/reward should be required.
Any reward above 2x the risk will be ideal though.
Closing using supports and resistances
We all know that the price tends to halt, at least temporarily, when it hits supports and resistances.
When we have a clear view of a support or resistance to where the price is heading, we may use it as our target, and let the trade run until the price hits that level.
Pro tip
Using a combination of extensions, risk/reward, and supports/resistances to set your targets may prevent you from entering into less worthy trades.
Here’s what you learned today
- Fibonacci trading is a way of trading after pullbacks that touched on special levels.
- The Fibonacci retracement levels that we should focus on are the 23.6, 38.2, 50, 61.8 and 78.6% levels.
- A Fibonacci extension tells us how big was the second wave compared to the previous one and can be used to set targets.
- The Fibonacci retracement levels to trade should be chosen based on the current market conditions.
Now I want to hear from you.
How do you use Fibonacci retracement and expansion levels to trade?
Let me know below in the comments.