
The Japanese candlestick chart patterns are the most popular way of reading trading charts.
Why?
Because they are simple to understand and tend to work very well when we trade with them.
Today you’ll learn about all the candlestick patterns that exist, how to identify them on your charts, where should you be looking for them, and what to expect to happen after they appear.
Even better, you’ll know the success rate for each of the patterns, according to the Encyclopedia of Candlestick Charts by Thomas N. Bulkowski (link).
Ready?
Here’s the list if you want to jump into any particular pattern, otherwise just keep reading.
- Bullish Reversal Candlestick Patterns
- Bearish Reversal Candlestick Patterns
- Bullish Continuation Candlestick Patterns
- Bearish Continuation Candlestick Patterns
- Indecision Candlestick Patterns
Bullish Reversal Candlestick Patterns
Bullish reversal candlestick patterns show that buyers are in control, or regaining control of a movement.
They are often used to go long, but can also be a warning signal to close short positions.
Here’s an extensive list of them:
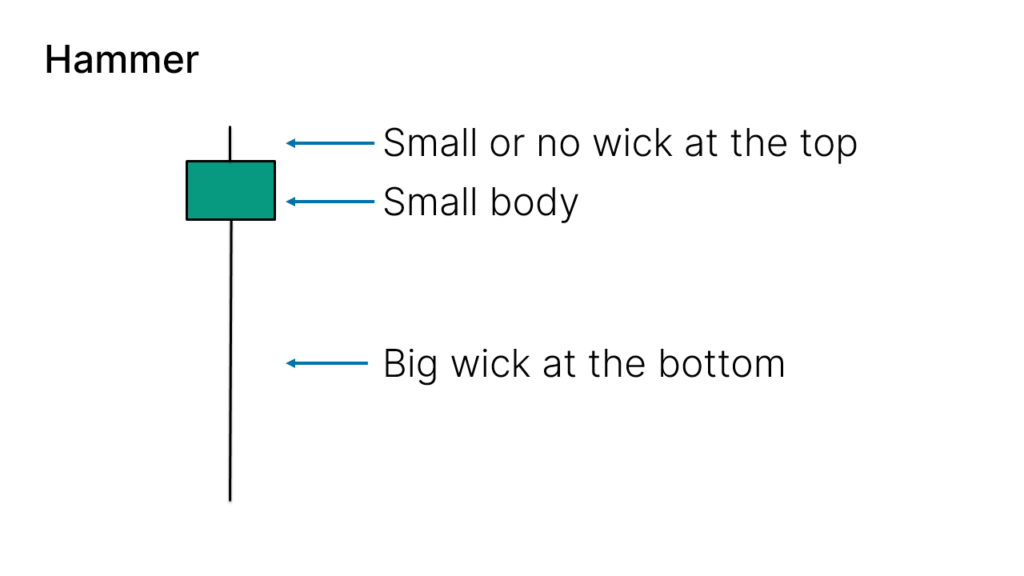
Hammer
The Hammer candlestick pattern is formed by one single candle.
Here’s how to identify the Hammer candlestick pattern:
- The candle has a small body
- The wick at the bottom must be big compared to the body
- At the top, it should have no wick, or be very small
- The color of the body doesn’t matter
It looks like this on your charts:
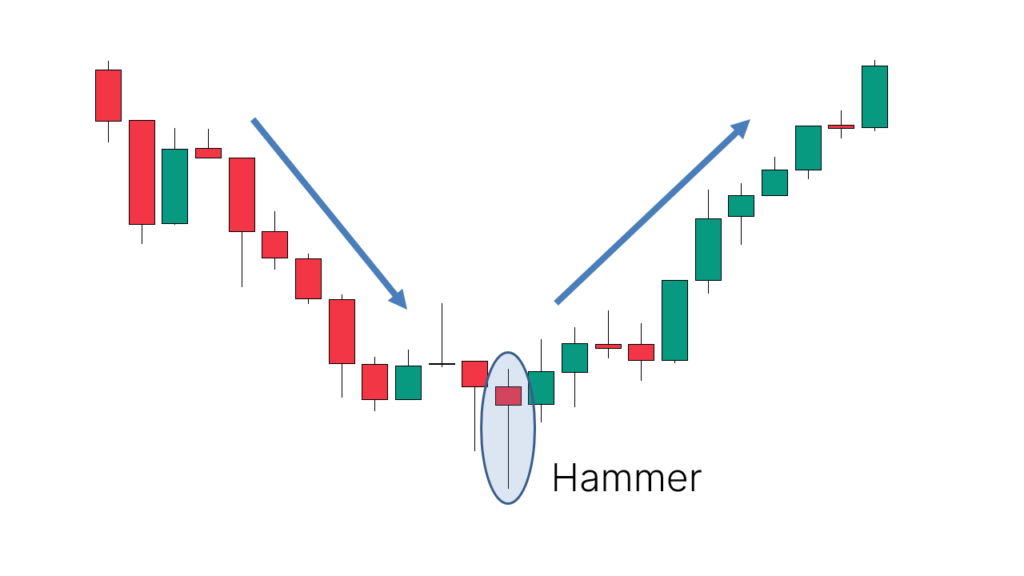
This 1-candle bullish candlestick pattern is a reversal pattern, meaning that it’s used to find bottoms.
For this reason, we want to see this pattern after a move to the downside, showing that bulls are starting to take control.
The success rate of this pattern is 60%.
When a hammer candlestick pattern appears at the right location, it may show:
- The end of a downtrend and start of an uptrend
- The end of a pullback, resuming an uptrend
Here’s an example of a chart showing a trend reversal after a hammer candlestick pattern appeared:
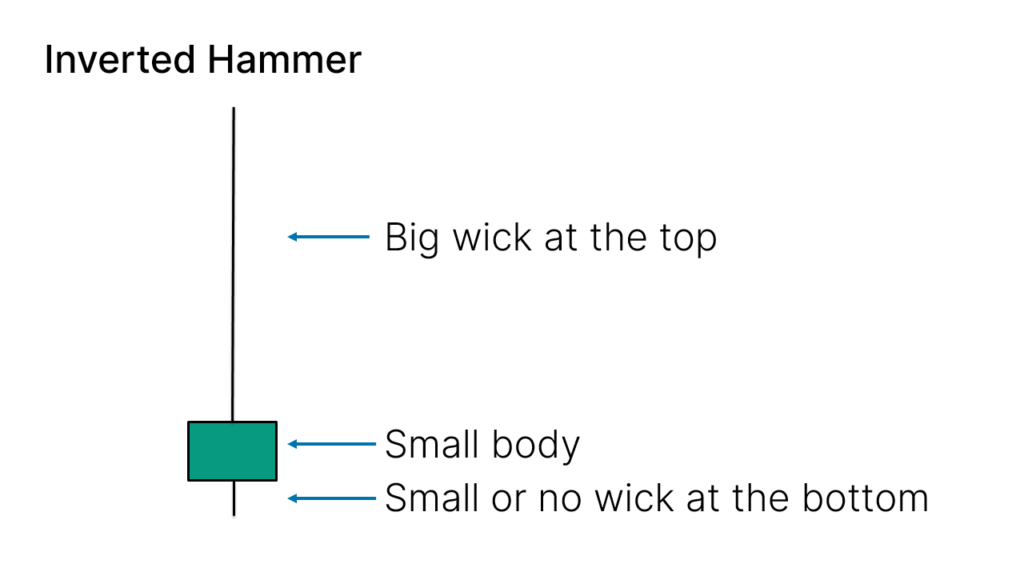
Inverted Hammer
The Inverted Hammer candlestick pattern is formed by one single candle.
Here’s how to identify the Inverted Hammer candlestick pattern:
- The candle has a small body
- The wick at the top must be big compared to the body
- At the bottom, it should have no wick, or be very small
- The color of the body doesn’t matter
It looks like this on your charts:
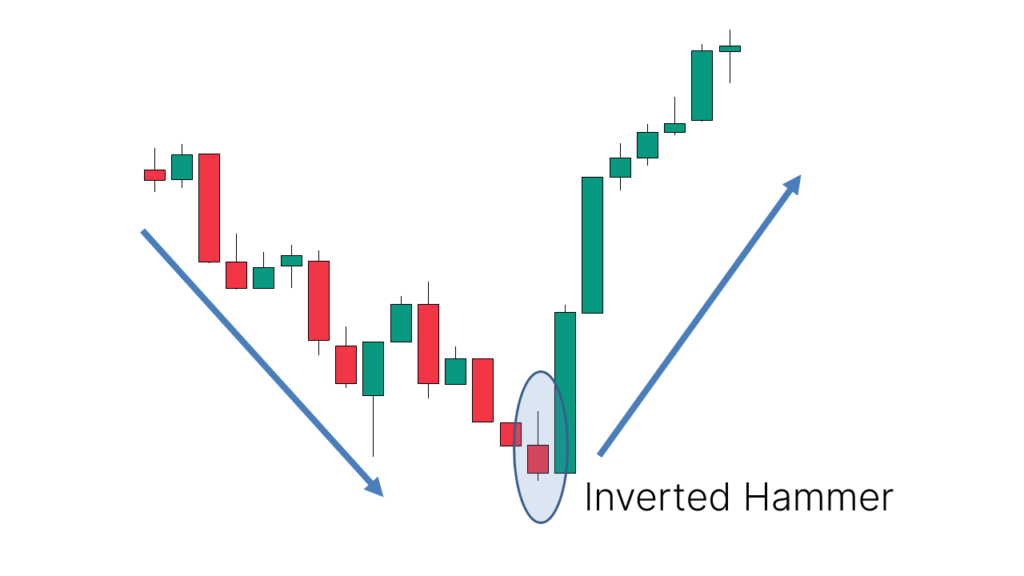
This 1-candle bullish candlestick pattern is a reversal pattern, meaning that it’s used to find bottoms.
For this reason, we want to see this pattern after a move to the downside, showing that bulls are starting to take control.
The success rate of this pattern is 67%.
When an inverted hammer candlestick pattern appears at the right location, it may show:
- The end of a downtrend and start of an uptrend
- The end of a pullback, resuming an uptrend
Here’s an example of a chart showing a trend reversal after an inverted hammer candlestick pattern appeared:
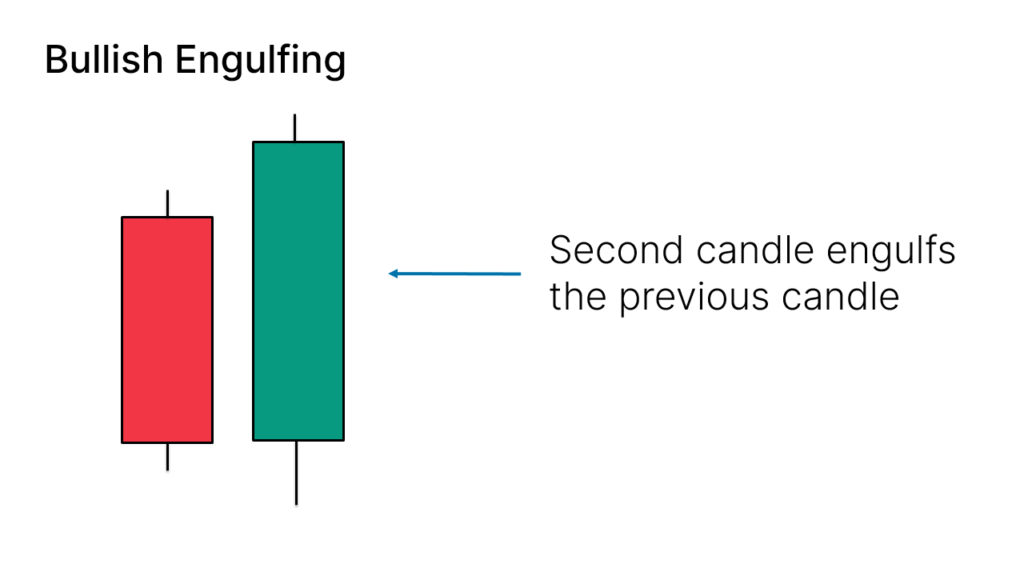
Bullish Engulfing
The Bullish Engulfing candlestick pattern is formed by two candles.
Here’s how to identify the Bullish Engulfing candlestick pattern:
- The first candle must be bearish
- The second candle must be bullish
- The body of the second candle must cover the body of the first candle
It looks like this on your charts:
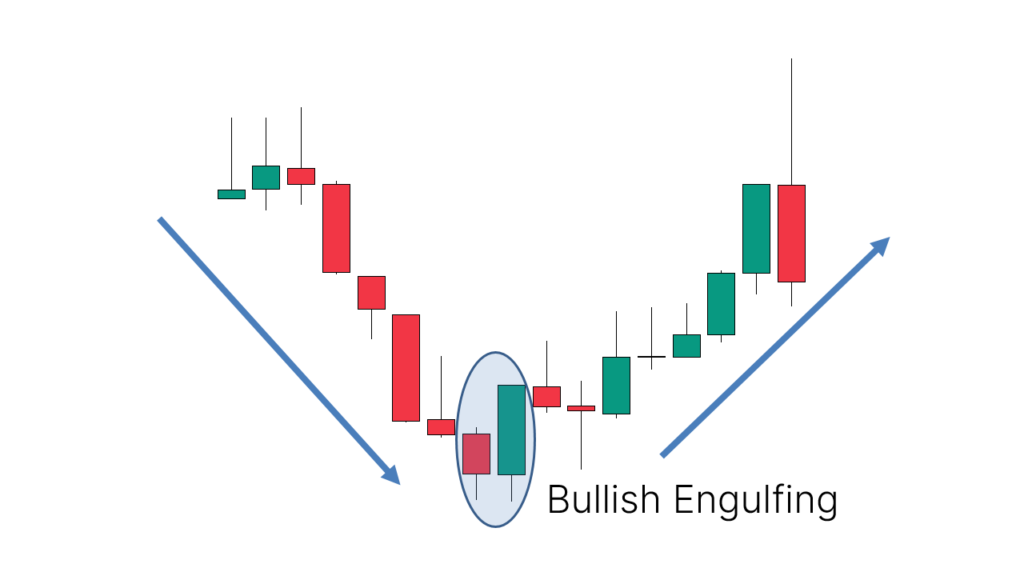
This 2-candle bullish candlestick pattern is a reversal pattern, meaning that it’s used to find bottoms.
For this reason, we want to see this pattern after a move to the downside, showing that bulls are starting to take control.
The success rate of this pattern is 62%.
When a Bullish Engulfing candlestick pattern appears at the right location, it may show:
- The end of a downtrend and start of an uptrend
- The end of a pullback, resuming an uptrend
Here’s an example of a chart showing a trend reversal after a Bullish Engulfing candlestick pattern appeared:
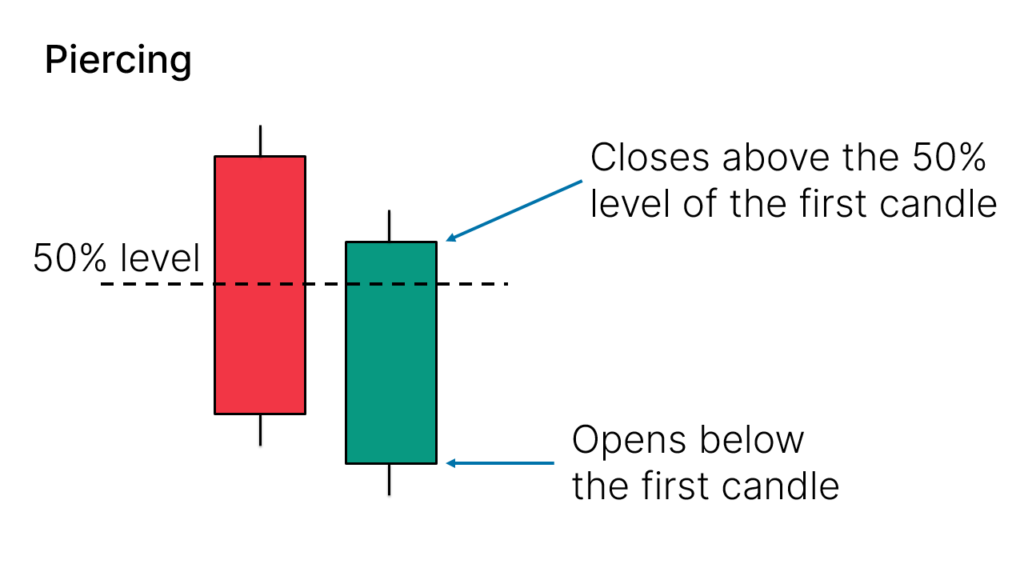
Piercing
The Piercing candlestick pattern is formed by two candles.
Here’s how to identify the Piercing candlestick pattern:
- The first candle must be bearish
- The second candle must be bullish
- The open level of the second candle must be below the first candle (there’s a gap there)
- The close of the second candle must be above the 50% level of the body of the first candle
It looks like this on your charts:
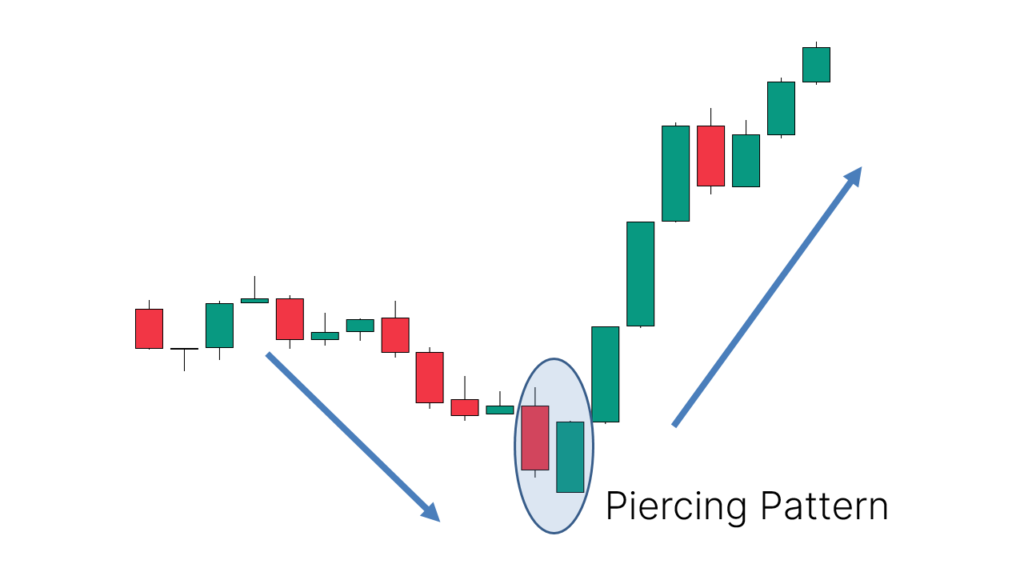
This 2-candle bullish candlestick pattern is a reversal pattern, meaning that it’s used to find bottoms.
For this reason, we want to see this pattern after a move to the downside, showing that bulls are starting to take control.
The success rate of this pattern is 64%.
When a Piercing candlestick pattern appears at the right location, it may show:
- The end of a downtrend and start of an uptrend
- The end of a pullback, resuming an uptrend
Here’s an example of a chart showing a trend reversal after a Piercing candlestick pattern appeared:
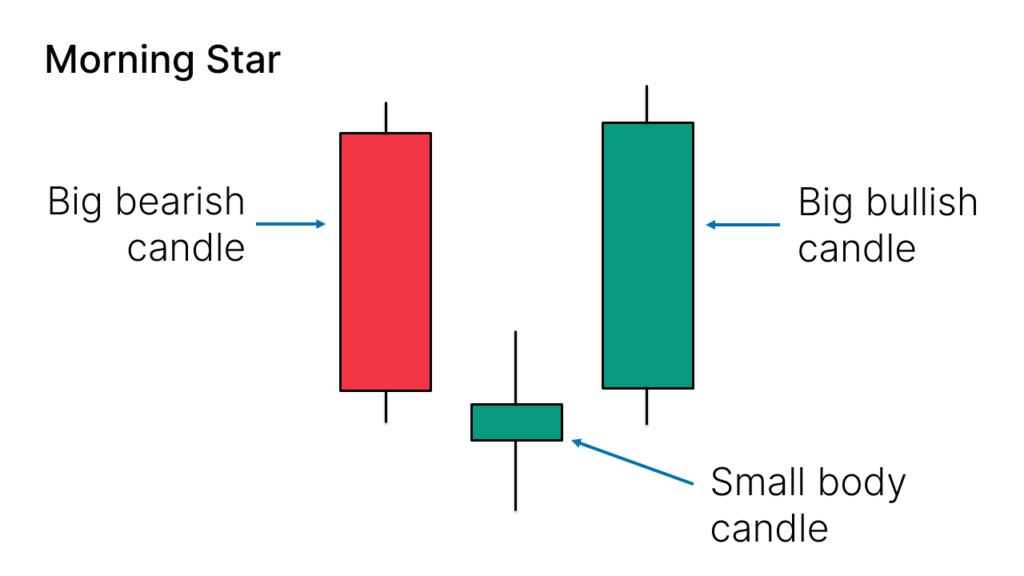
Morning Star
The Morning Star candlestick pattern is formed by three candles.
Here’s how to identify the Morning Star candlestick pattern:
- The first candle must be bearish
- The third candle must be bullish
- The second candle must be small compared to the others, like a Doji or a Spinning Top
- The color of the second candle doesn’t matter
- Ideally, the body of the second candle shouldn’t overlap with the bodies of the other two candles
It looks like this on your charts:
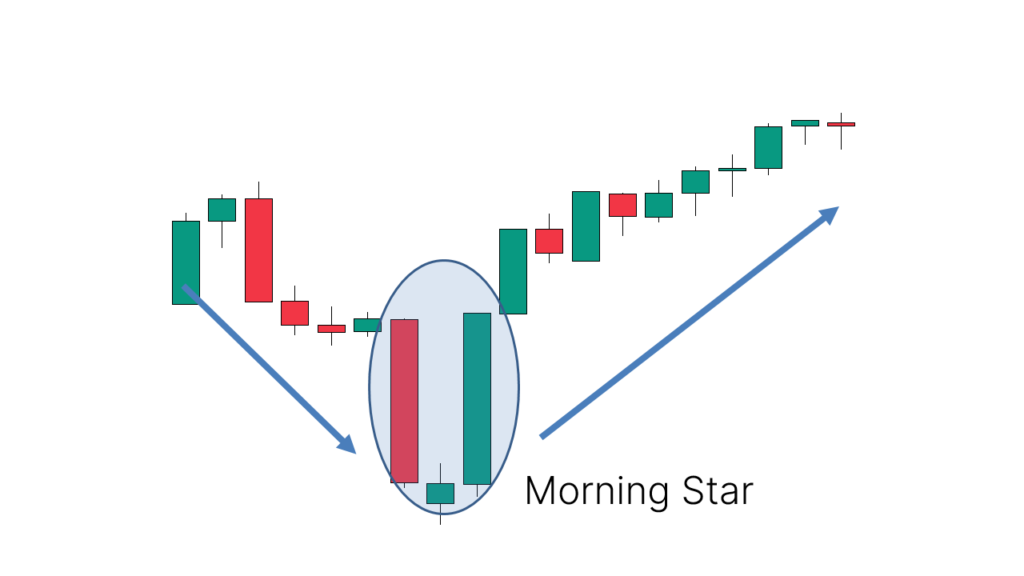
This 3-candle bullish candlestick pattern is a reversal pattern, meaning that it’s used to find bottoms.
For this reason, we want to see this pattern after a move to the downside, showing that bulls are starting to take control.
The success rate of this pattern is 78%.
When a Morning Star candlestick pattern appears at the right location, it may show:
- The end of a downtrend and start of an uptrend
- The end of a pullback, resuming an uptrend
Here’s an example of a chart showing a trend reversal after a Morning Star candlestick pattern appeared:
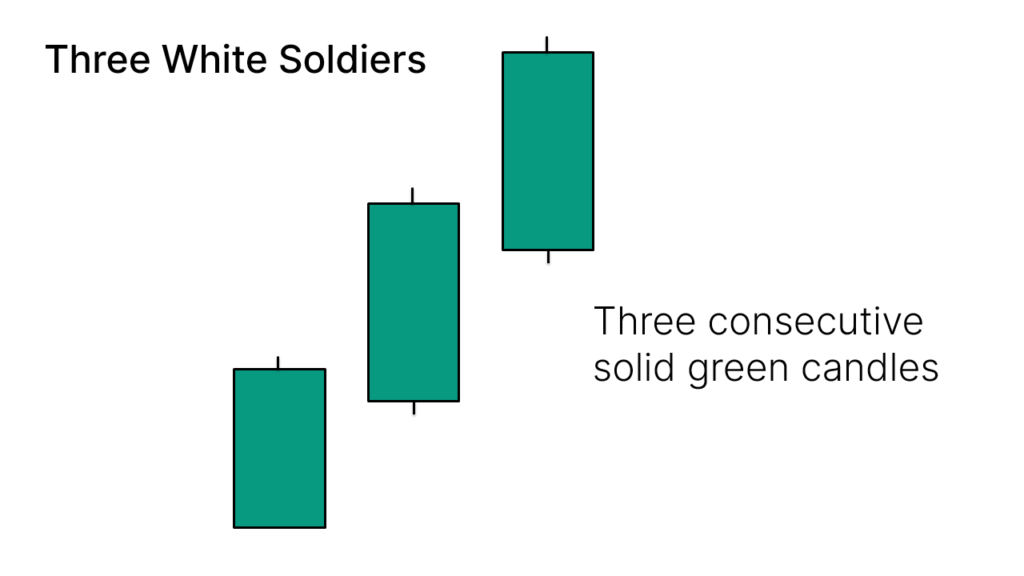
Three White Soldiers
The Three White Soldiers candlestick pattern is formed by three candles.
Here’s how to identify the Three White Soldiers candlestick pattern:
- Three consecutive bullish candles
- The bodies should be big
- The wicks should be small or non-existent
It looks like this on your charts:
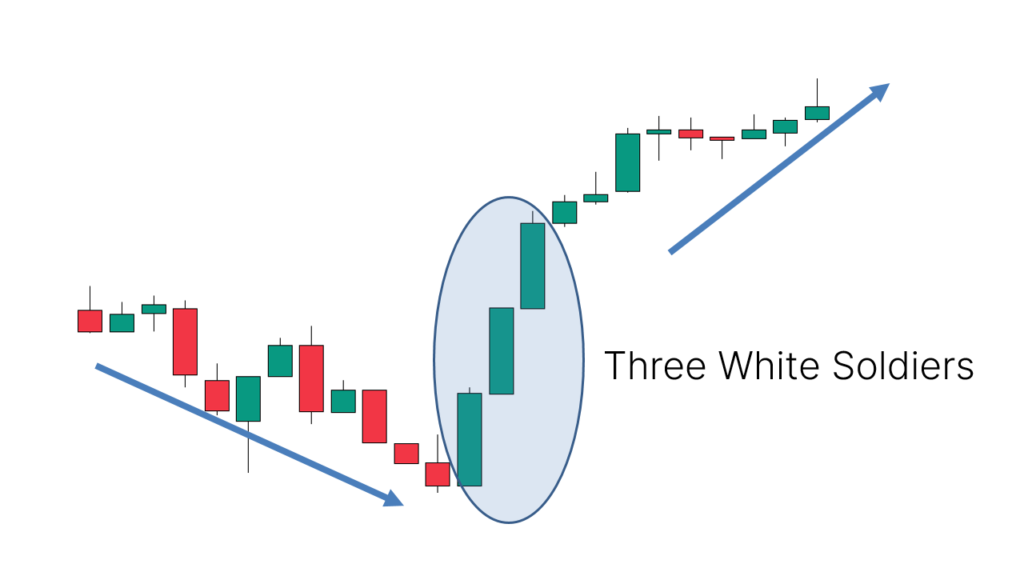
This 3-candle bullish candlestick pattern is a reversal pattern, meaning that it’s used to find bottoms.
For this reason, we want to see this pattern after a move to the downside, showing that bulls are starting to take control.
The success rate of this pattern is 84%.
When a Three White Soldiers candlestick pattern appears at the right location, it may show:
- The end of a downtrend and start of an uptrend
- The end of a pullback, resuming an uptrend
Here’s an example of a chart showing a trend reversal after a Three White Soldiers candlestick pattern appeared:
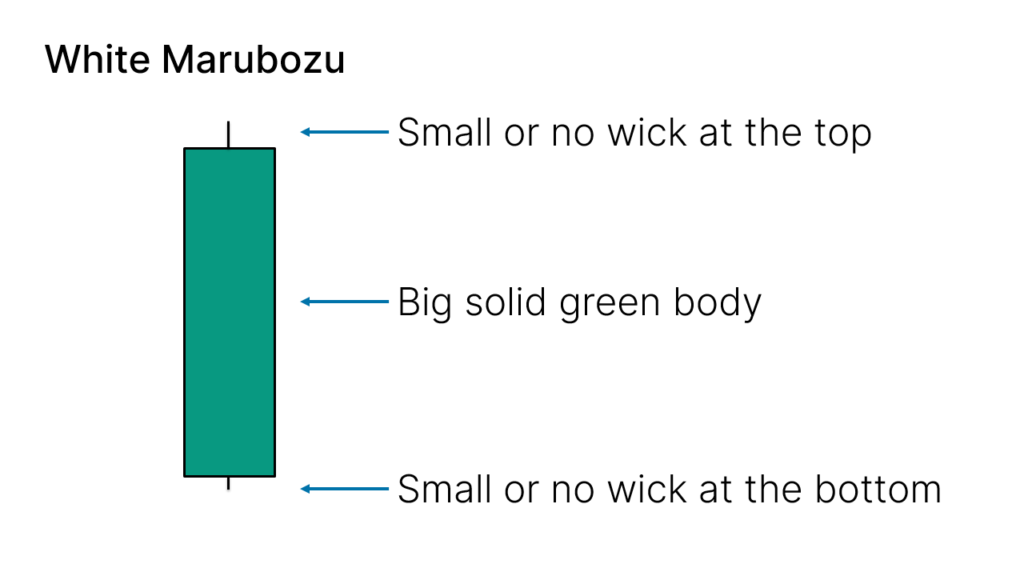
White Marubozu
The White Marubozu candlestick pattern is formed by one single candle.
Here’s how to identify the White Marubozu candlestick pattern:
- One single bullish candle
- The body must be big
- The wicks should be small or non-existent
It looks like this on your charts:
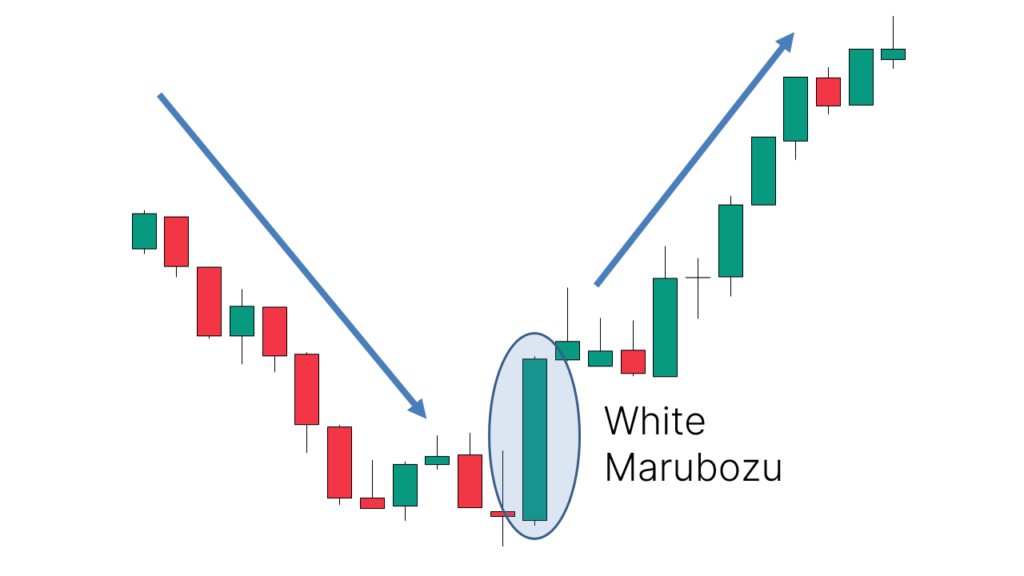
This 1-candle bullish candlestick pattern is a reversal pattern, meaning that it’s used to find bottoms.
For this reason, we want to see this pattern after a move to the downside, showing that bulls are starting to take control.
The success rate of this pattern is 71%.
When a White Marubozu candlestick pattern appears at the right location, it may show:
- The end of a downtrend and start of an uptrend
- The end of a pullback, resuming an uptrend
Here’s an example of a chart showing a trend reversal after a White Marubozu candlestick pattern appeared:
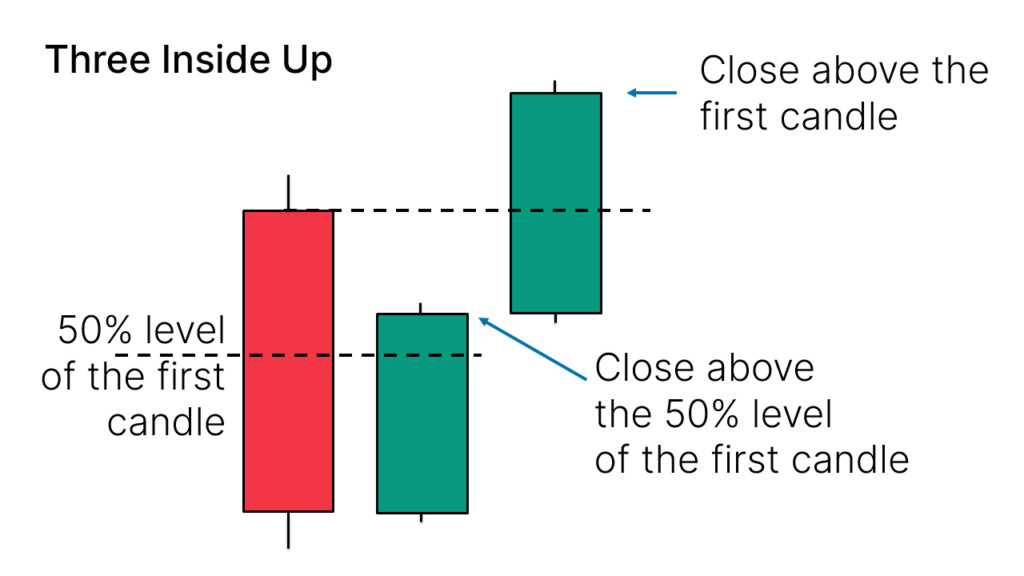
Three Inside Up
The Three Inside Up candlestick pattern is formed by three candles.
Here’s how to identify the Three Inside Up candlestick pattern:
- The first candle must be bearish
- The second candle must be bullish
- The close of the second candle should ideally be above the 50% level of the body of the first one
- The third candle should close above the first one
It looks like this on your charts:
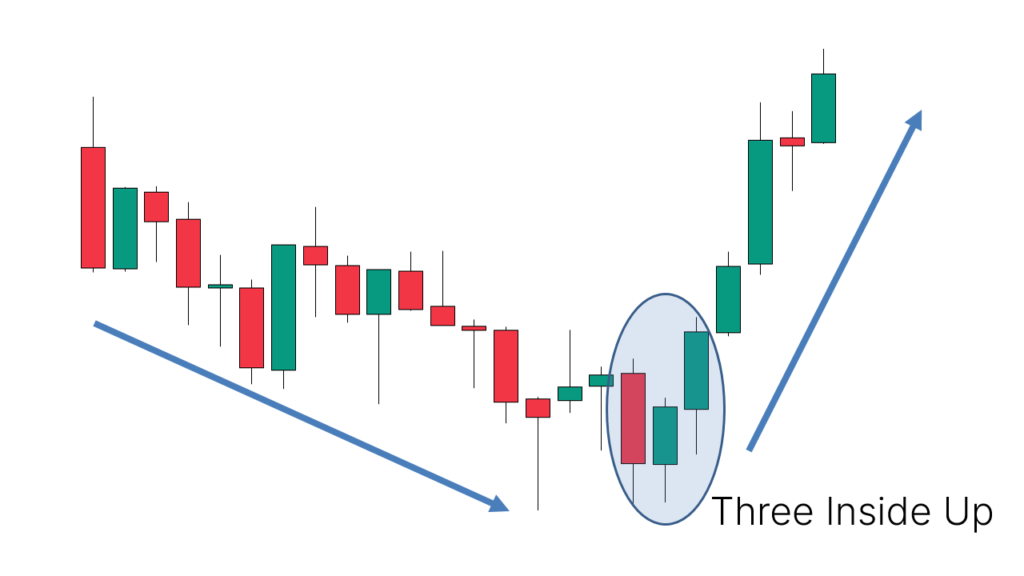
This 3-candle bullish candlestick pattern is a reversal pattern, meaning that it’s used to find bottoms.
For this reason, we want to see this pattern after a move to the downside, showing that bulls are starting to take control.
The success rate of this pattern is 65%.
When a Three Inside Up candlestick pattern appears at the right location, it may show:
- The end of a downtrend and start of an uptrend
- The end of a pullback, resuming an uptrend
Here’s an example of a chart showing a trend reversal after a Three Inside Up candlestick pattern appeared:
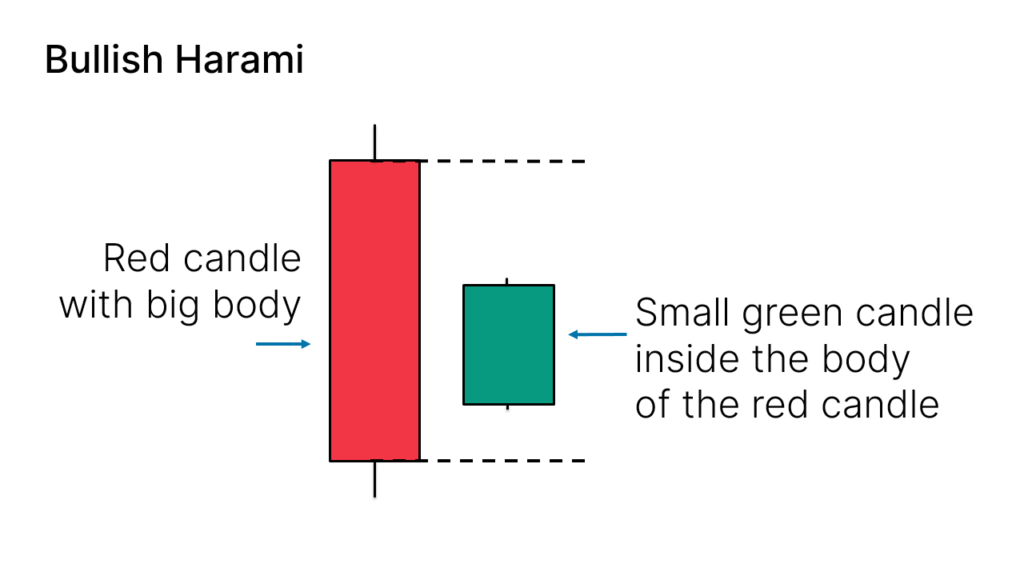
Bullish Harami
The Bullish Harami candlestick pattern is formed by two candles.
Here’s how to identify the Bullish Harami candlestick pattern:
- The first candle must be bearish and have a big body
- The second candle must be small and bullish
- The second candle is inside the body of the first candle
It looks like this on your charts:
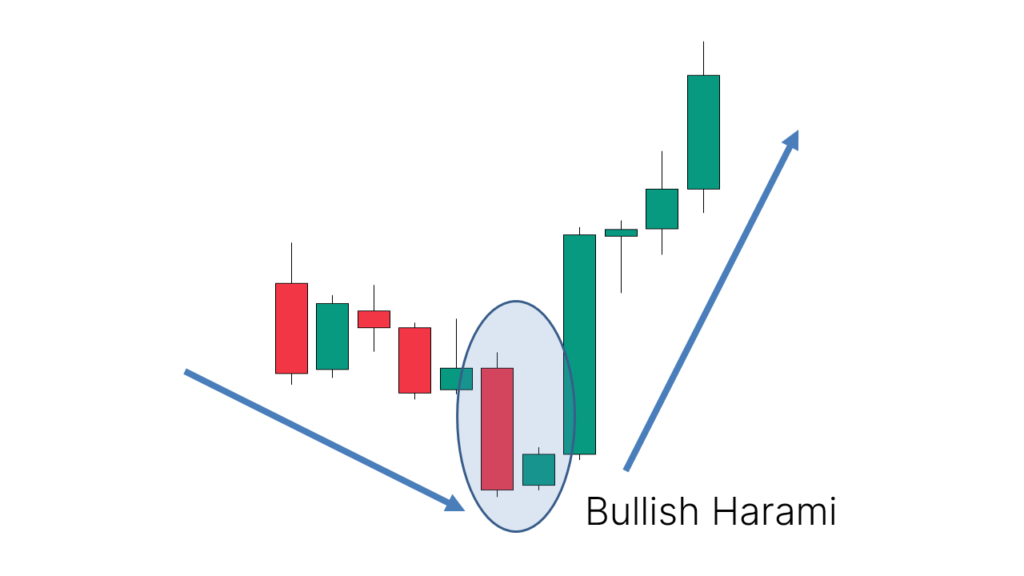
This 2-candle bullish candlestick pattern is a reversal pattern, meaning that it’s used to find bottoms.
For this reason, we want to see this pattern after a move to the downside, showing that bulls are starting to take control.
The success rate of this pattern is 53%.
When a Bullish Harami candlestick pattern appears at the right location, it may show:
- The end of a downtrend and start of an uptrend
- The end of a pullback, resuming an uptrend
Here’s an example of a chart showing a trend reversal after a Bullish Harami candlestick pattern appeared:
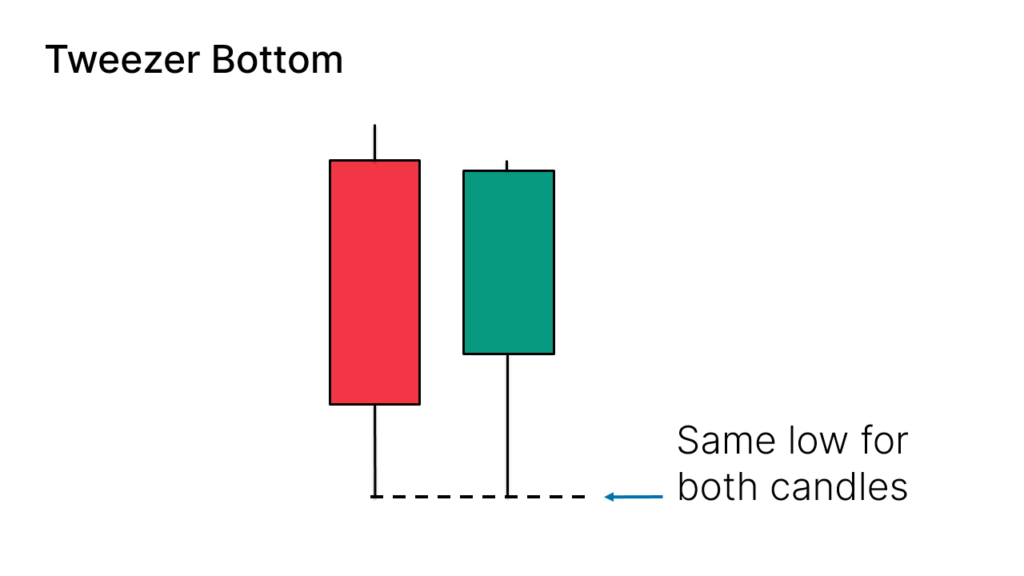
Tweezer Bottom
The Tweezer Bottom candlestick pattern is formed by two candles.
Here’s how to identify the Tweezer Bottom candlestick pattern:
- The first candle is bearish
- The second candle is bullish
- The lows from both candles should be pretty much at the same level
It looks like this on your charts:
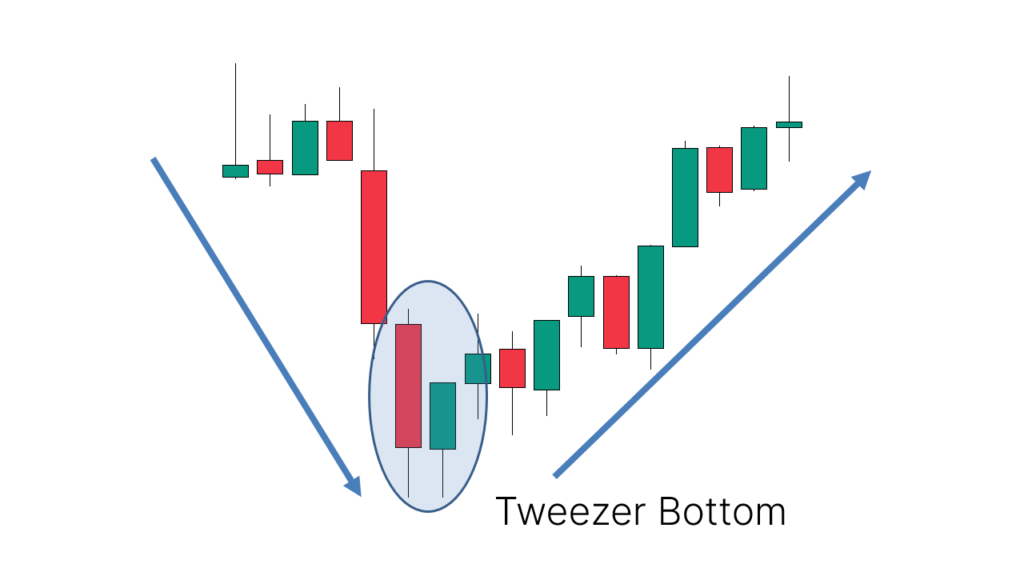
This 2-candle bullish candlestick pattern is a reversal pattern, meaning that it’s used to find bottoms.
For this reason, we want to see this pattern after a move to the downside, showing that bulls are starting to take control.
The success rate of this pattern is 56%.
When a Tweezer Bottom candlestick pattern appears at the right location, it may show:
- The end of a downtrend and start of an uptrend
- The end of a pullback, resuming an uptrend
Here’s an example of a chart showing a trend reversal after a Tweezer Bottom candlestick pattern appeared:
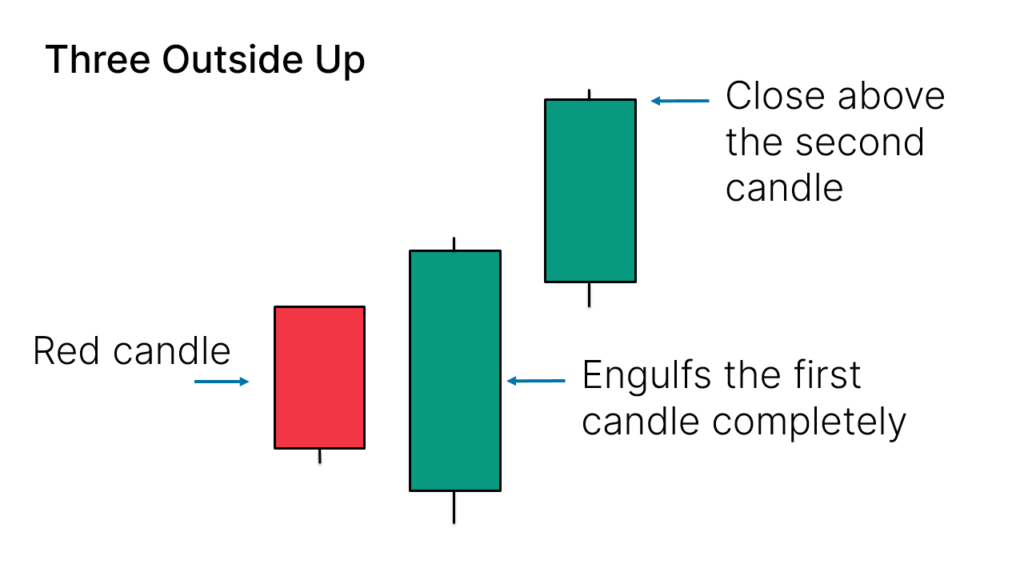
Three Outside Up
The Three Outside Up candlestick pattern is formed by three candles.
Here’s how to identify the Three Outside Up candlestick pattern:
- The first candle is bearish and small
- The second candle is bullish and engulfs the first one completely
- The third candle is bullish and closes above the other ones
It looks like this on your charts:
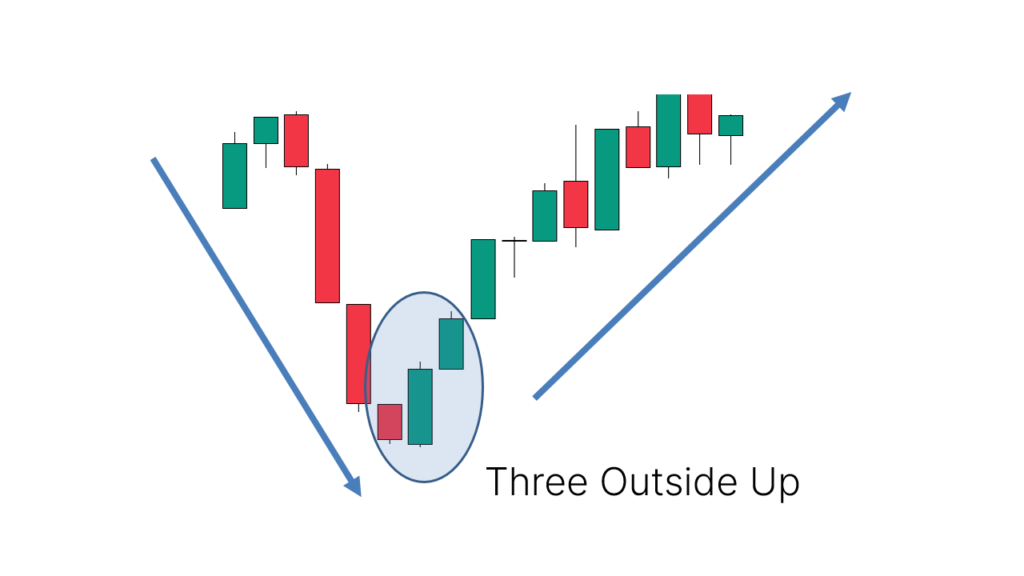
This 3-candle bullish candlestick pattern is a reversal pattern, meaning that it’s used to find bottoms.
For this reason, we want to see this pattern after a move to the downside, showing that bulls are starting to take control.
The success rate of this pattern is 75%.
When a Three Outside Up candlestick pattern appears at the right location, it may show:
- The end of a downtrend and start of an uptrend
- The end of a pullback, resuming an uptrend
Here’s an example of a chart showing a trend reversal after a Three Outside Up candlestick pattern appeared:
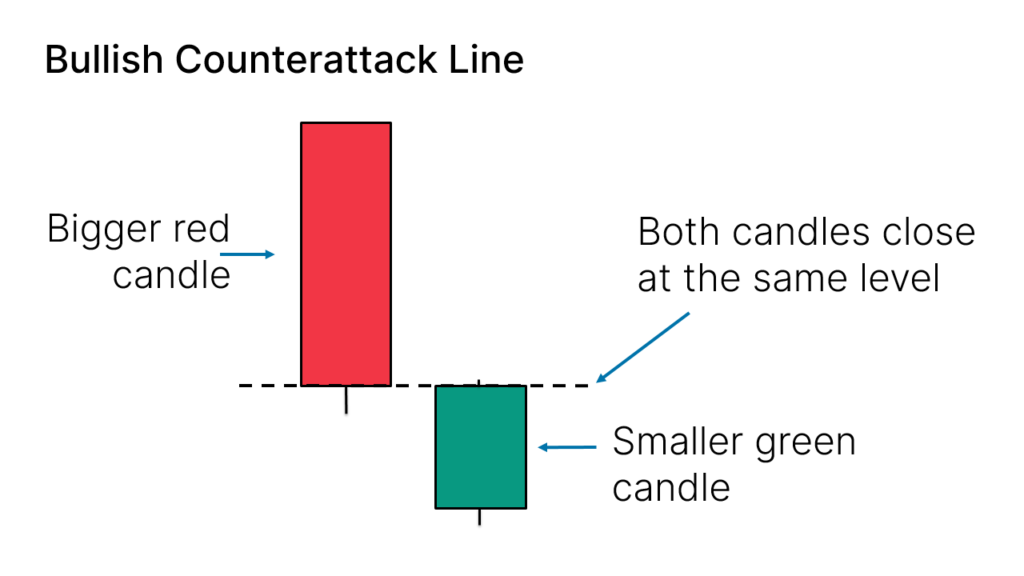
Bullish Counterattack Line
The Bullish Counterattack Line candlestick pattern is formed by two candles.
Here’s how to identify the Bullish Counterattack candlestick pattern:
- The first candle is bearish and big
- The second candle is bullish and small
- There’s a gap between the close of the first candle and the open of the second candle
- They both close at the same level
It looks like this on your charts:
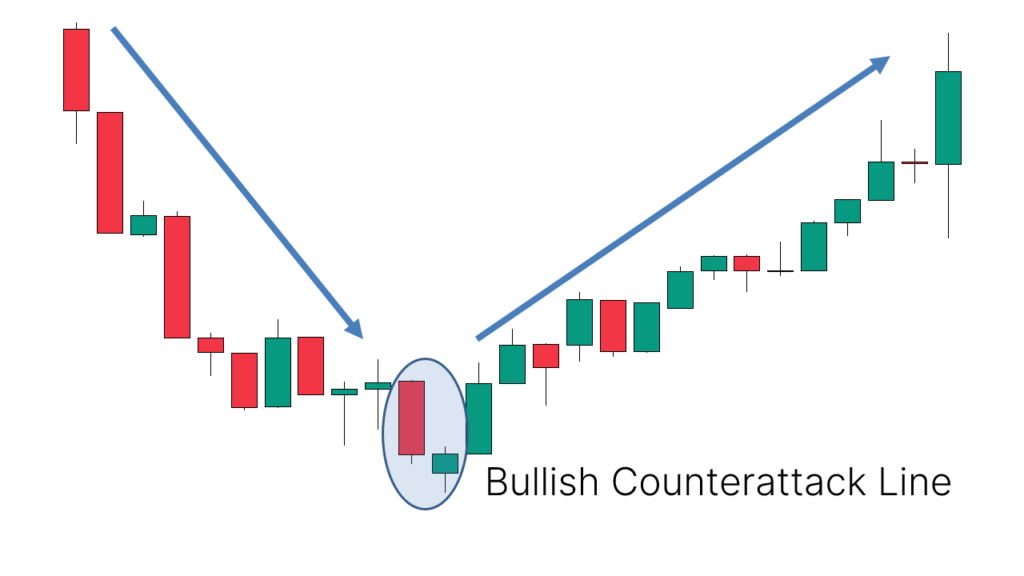
This 2-candle bullish candlestick pattern is a reversal pattern, meaning that it’s used to find bottoms.
For this reason, we want to see this pattern after a move to the downside, showing that bulls are starting to take control.
When a Bullish Counterattack Line candlestick pattern appears at the right location, it may show:
- The end of a downtrend and start of an uptrend
- The end of a pullback, resuming an uptrend
Here’s an example of a chart showing a trend reversal after a Bullish Counterattack Line candlestick pattern appeared:
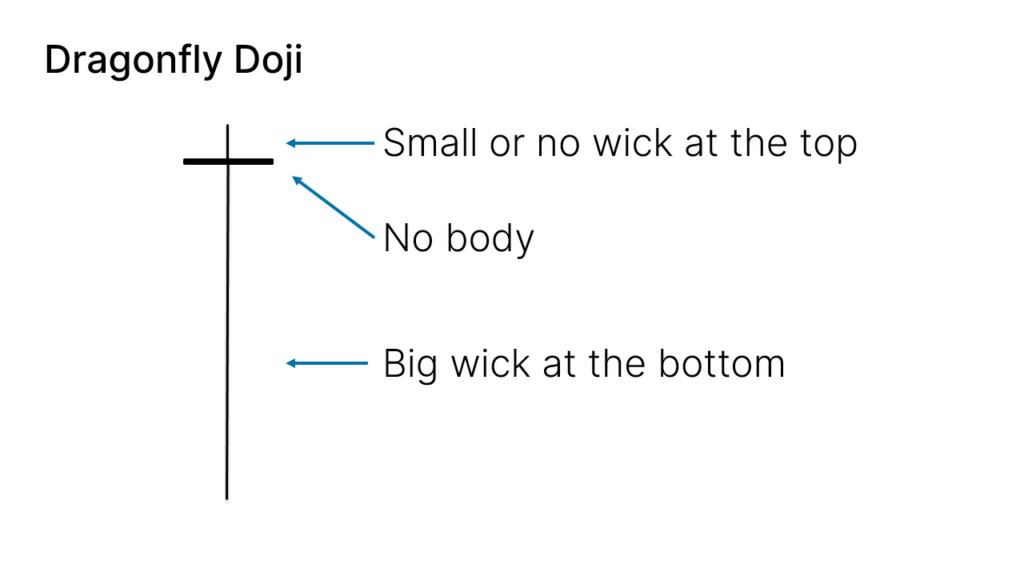
Dragonfly Doji
The Dragonfly Doji candlestick pattern is formed by one single candle.
Here’s how to identify the Dragonfly Doji candlestick pattern:
- The candle has no body
- The wick at the bottom must be big
- At the top, it should have no wick, or be very small
It looks like this on your charts:
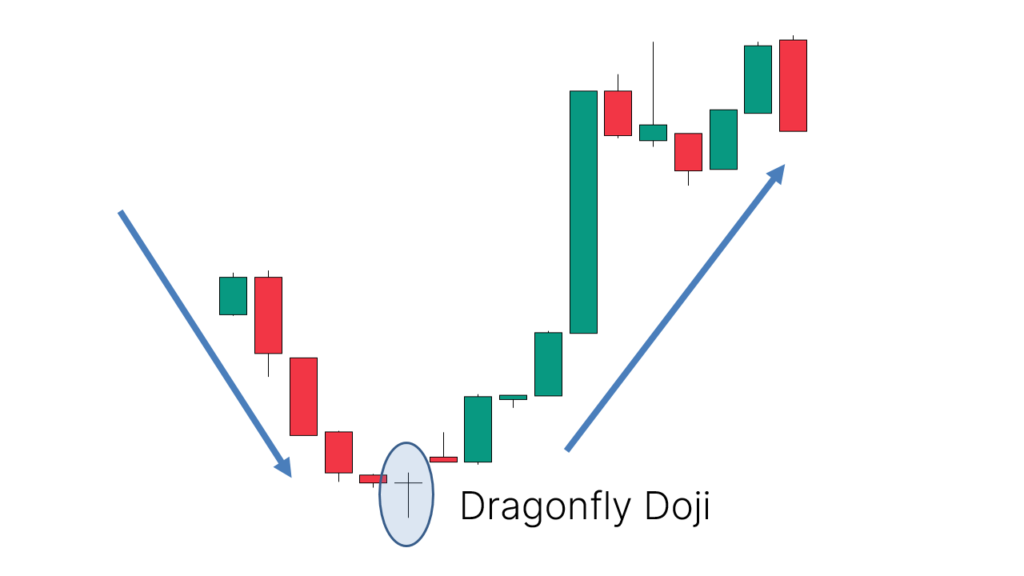
This 1-candle bullish candlestick pattern is a reversal pattern, meaning that it’s used to find bottoms.
For this reason, we want to see this pattern after a move to the downside, showing that bulls are starting to take control.
The success rate of this pattern is 51%.
When a Dragonfly Doji candlestick pattern appears at the right location, it may show:
- The end of a downtrend and start of an uptrend
- The end of a pullback, resuming an uptrend
Here’s an example of a chart showing a trend reversal after a Dragonfly Doji candlestick pattern appeared:
Bearish Reversal Candlestick Patterns
Bearish reversal candlestick patterns show that sellers are in control, or regaining control of a movement.
They are often used to short, but can also be a warning signal to close long positions.
Here’s an extensive list of them:
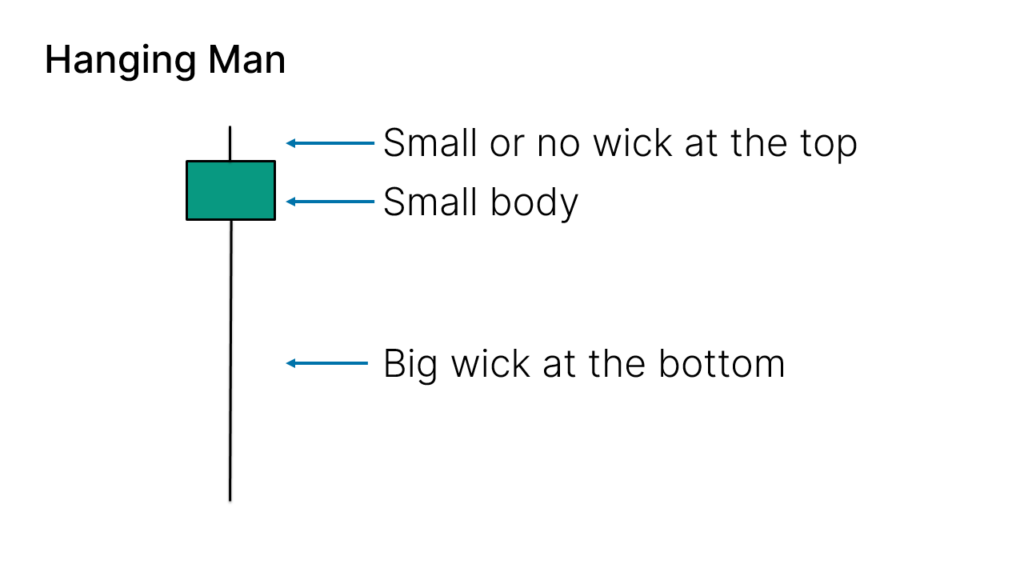
Hanging Man
The Hanging Man candlestick pattern is formed by one single candle.
Here’s how to identify the Hanging Man candlestick pattern:
- The candle has a small body
- The wick at the bottom must be big compared to the body
- At the top, it should have no wick, or be very small
- The color of the body doesn’t matter
It looks like this on your charts:
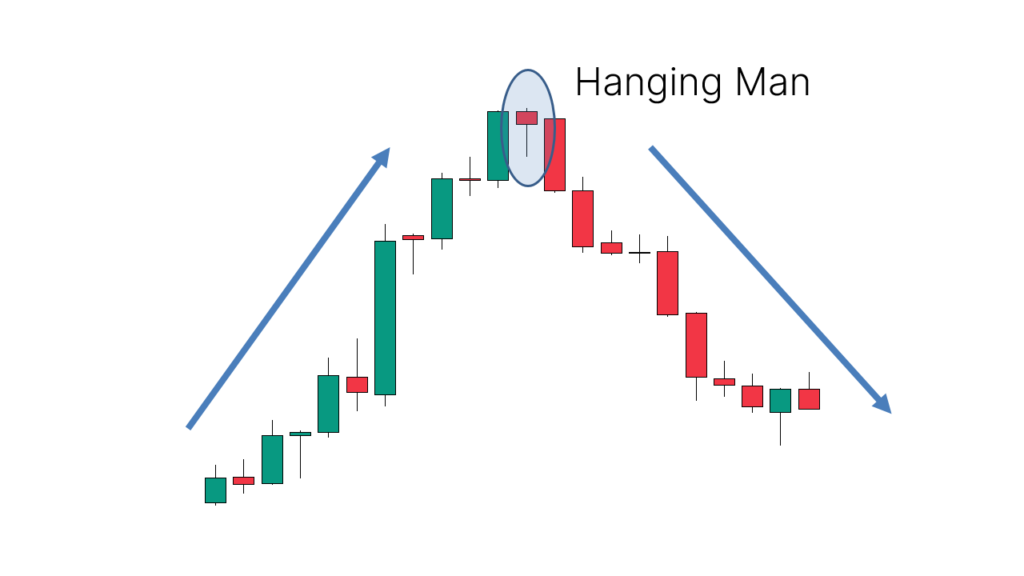
This 1-candle bearish candlestick pattern is a reversal pattern, meaning that it’s used to find tops.
For this reason, we want to see this pattern after a move to the upside, showing that bears are starting to take control.
The success rate of this pattern is 59%.
When a Hanging Man candlestick pattern appears at the right location, it may show:
- The end of an uptrend and start of a downtrend
- The end of a pullback, resuming a downtrend
Here’s an example of a chart showing a trend reversal after a Hanging Man candlestick pattern appeared:
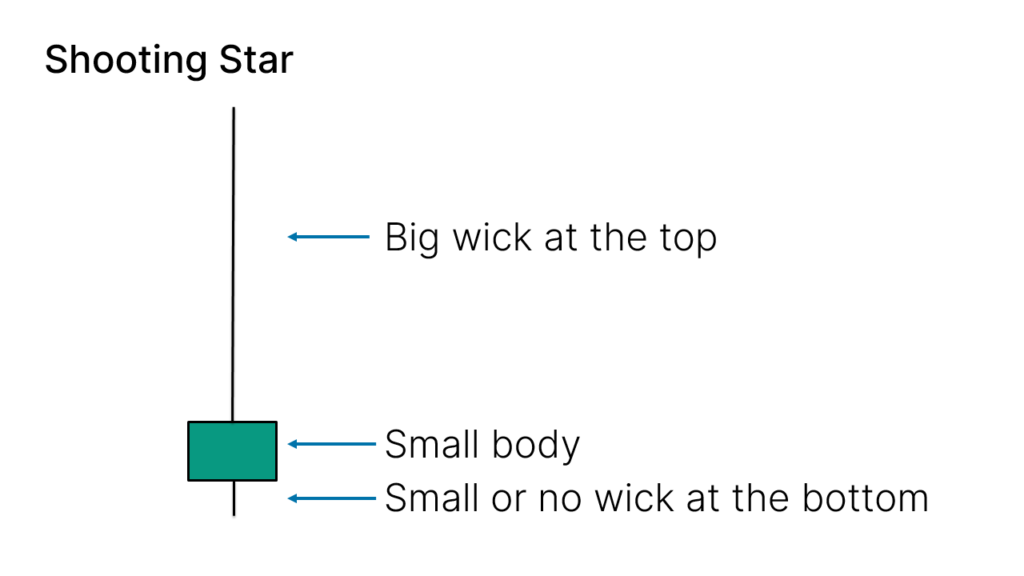
Shooting Star
The Shooting Star candlestick pattern is formed by one single candle.
Here’s how to identify the Shooting Star candlestick pattern:
- The candle has a small body
- The wick at the top must be big compared to the body
- At the bottom, it should have no wick, or be very small
- The color of the body doesn’t matter
It looks like this on your charts:
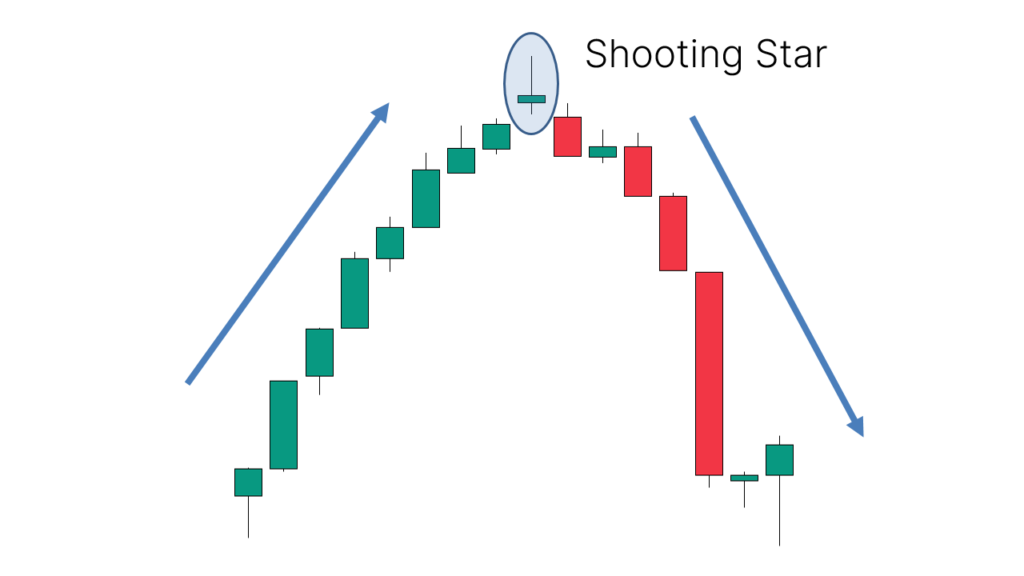
This 1-candle bearish candlestick pattern is a reversal pattern, meaning that it’s used to find tops.
For this reason, we want to see this pattern after a move to the upside, showing that bears are starting to take control.
The success rate of this pattern is 60%.
When a Shooting Star candlestick pattern appears at the right location, it may show:
- The end of an uptrend and start of a downtrend
- The end of a pullback, resuming a downtrend
Here’s an example of a chart showing a trend reversal after a Shooting Star candlestick pattern appeared:
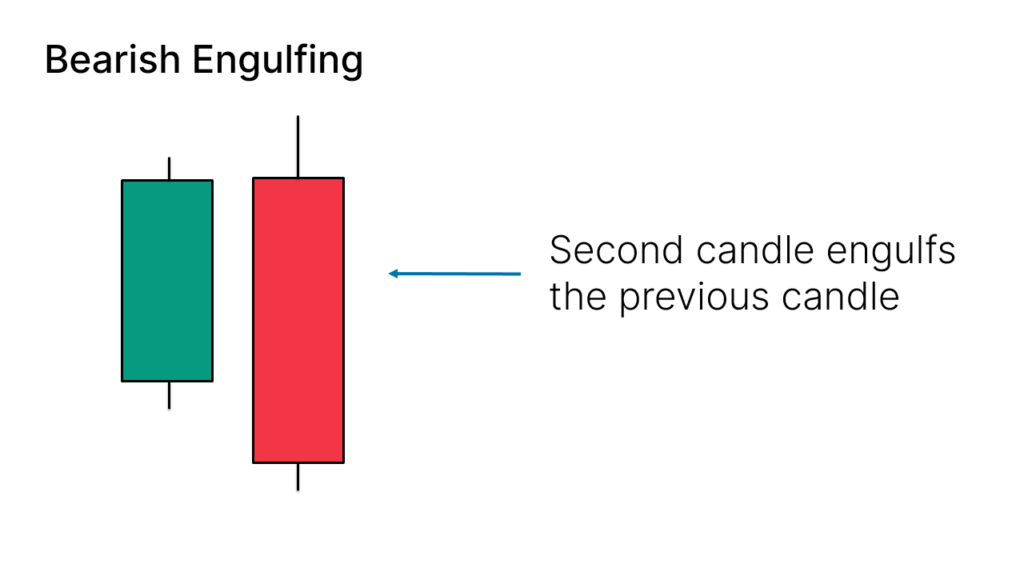
Bearish Engulfing
The Bearish Engulfing candlestick pattern is formed by two candles.
Here’s how to identify the Bearish Engulfing candlestick pattern:
- The first candle must be bullish
- The second candle must be bearish
- The body of the second candle must cover the body of the first candle
It looks like this
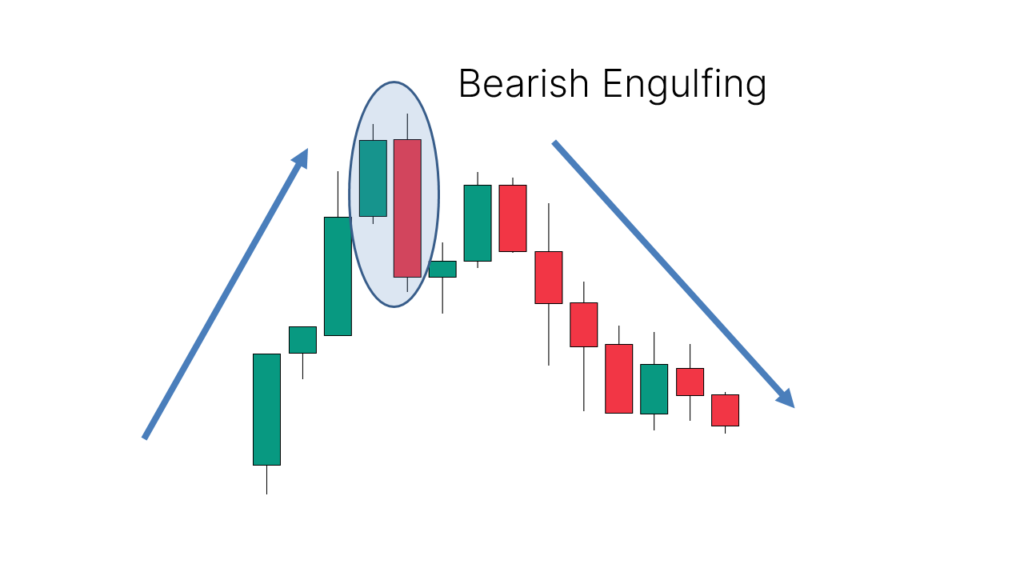
This 2-candle bearish candlestick pattern is a reversal pattern, meaning that it’s used to find tops.
For this reason, we want to see this pattern after a move to the upside, showing that bears are starting to take control.
The success rate of this pattern is 82%.
When a Bearish Engulfing candlestick pattern appears at the right location, it may show:
- The end of an uptrend and start of a downtrend
- The end of a pullback, resuming a downtrend
Here’s an example of a chart showing a trend reversal after a Bearish Engulfing candlestick pattern appeared:
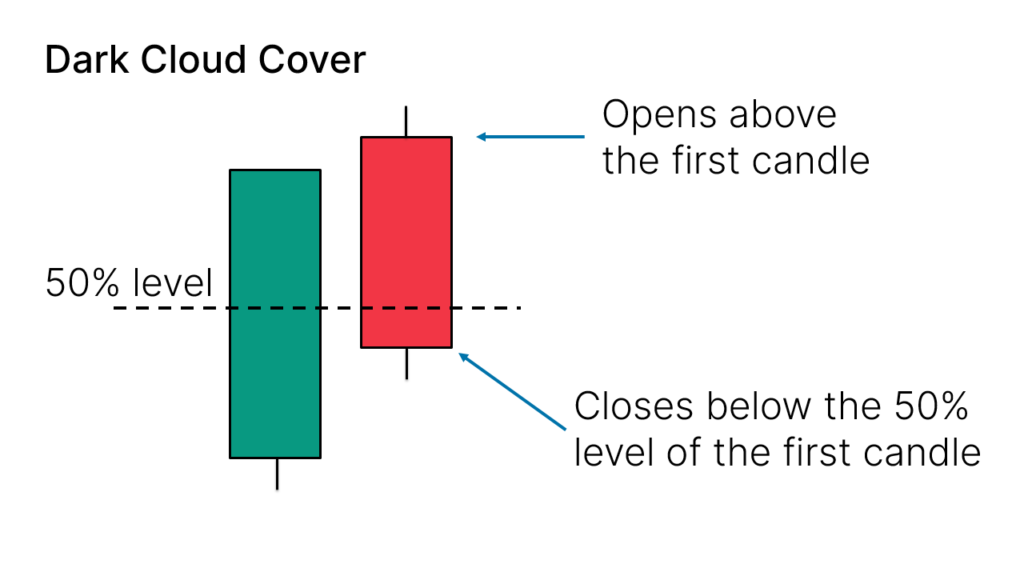
Dark Cloud Cover
The Dark Cloud Cover candlestick pattern is formed by two candles.
Here’s how to identify the Dark Cloud Cover candlestick pattern:
- The first candle is bullish
- The second candle is bearish
- The open level of the second candle must be above the first candle (there’s a gap there)
- The close of the second candle must be below the 50% level of the body of the first candle
It looks like this on your charts:
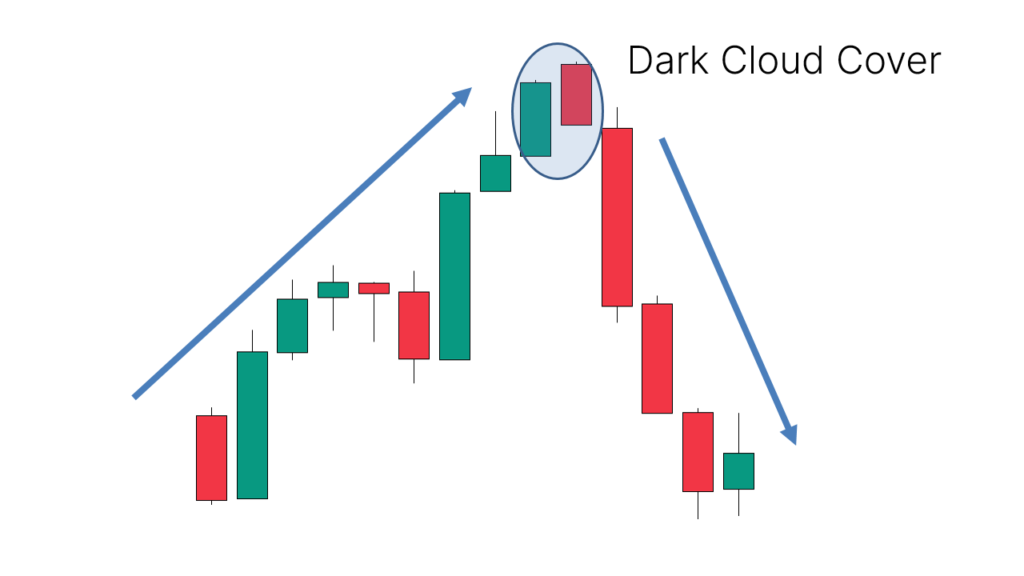
This 2-candle bearish candlestick pattern is a reversal pattern, meaning that it’s used to find tops.
For this reason, we want to see this pattern after a move to the upside, showing that bears are starting to take control.
The success rate of this pattern is 63%.
When a Dark Cloud Cover candlestick pattern appears at the right location, it may show:
- The end of an uptrend and start of a downtrend
- The end of a pullback, resuming a downtrend
Here’s an example of a chart showing a trend reversal after a Dark Cloud Cover candlestick pattern appeared:
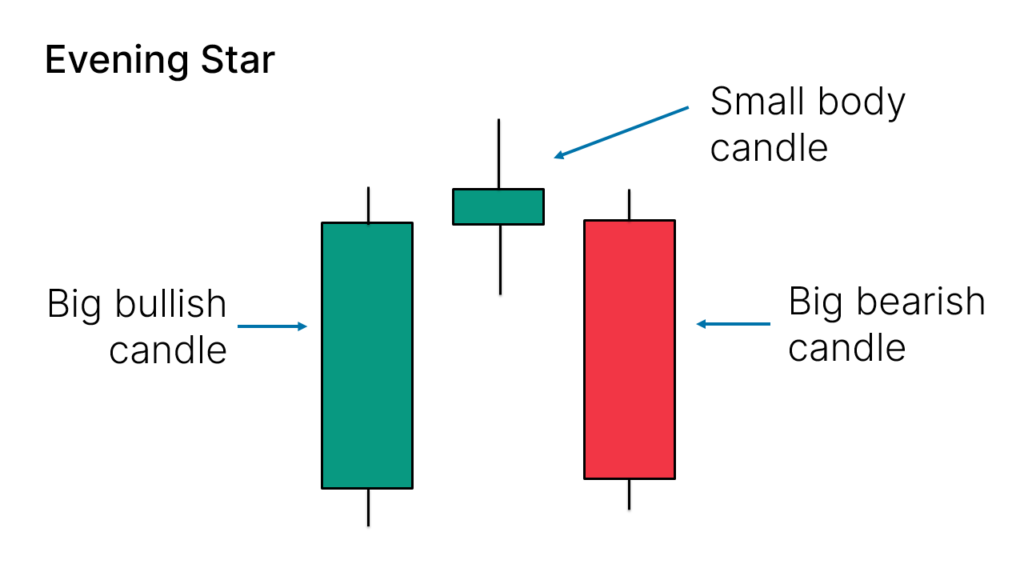
Evening Star
The Evening Star candlestick pattern is formed by three candles.
Here’s how to identify the Evening Star candlestick pattern:
- The first candle is bullish
- The third candle is bearish
- The second candle has a small body compared to the others
- The color of the second candle doesn’t matter
- Ideally, the body of the second candle shouldn’t overlap with the bodies of the other two candles
It looks like this on your charts:
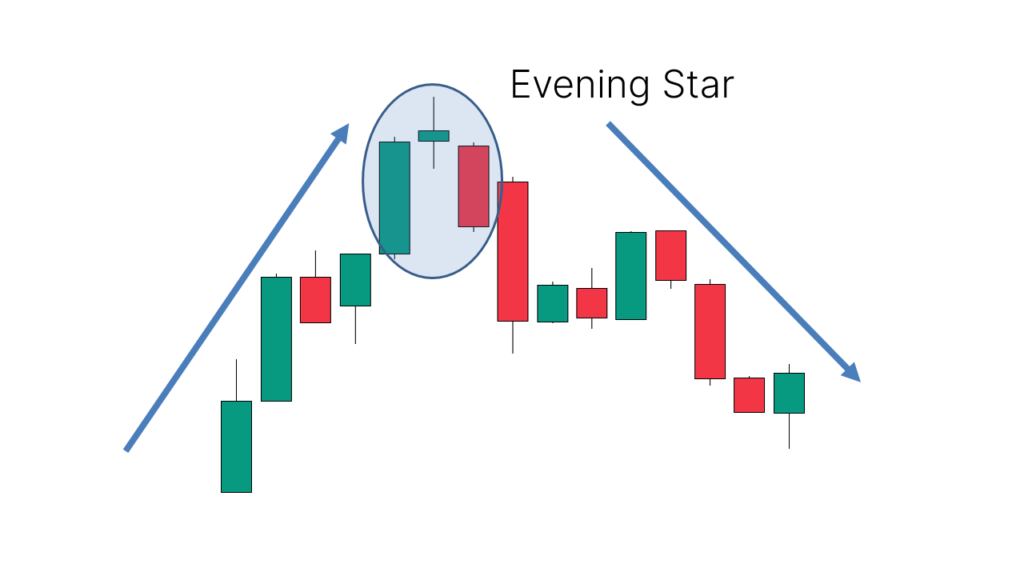
This 3-candle bearish candlestick pattern is a reversal pattern, meaning that it’s used to find tops.
For this reason, we want to see this pattern after a move to the upside, showing that bears are starting to take control.
The success rate of this pattern is 71%.
When an Evening Star candlestick pattern appears at the right location, it may show:
- The end of an uptrend and start of a downtrend
- The end of a pullback, resuming a downtrend
Here’s an example of a chart showing a trend reversal after an Evening Star candlestick pattern appeared:
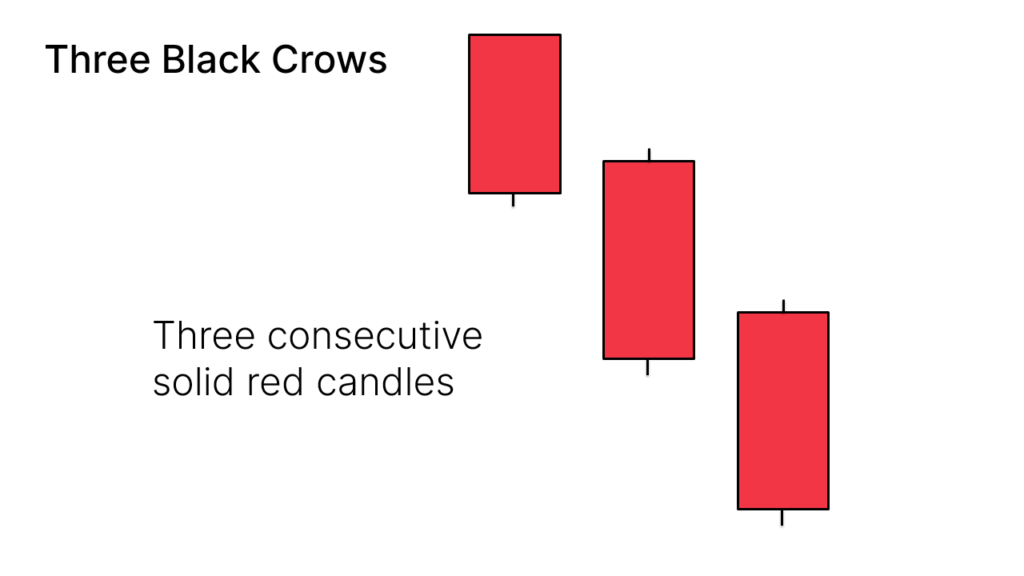
Three Black Crows
The Three Black Crows candlestick pattern is formed by three candles.
Here’s how to identify the Three Black Crows candlestick pattern:
- Three consecutive bearish candles
- The bodies should be big
- The wicks should be small or non-existent
It looks like this on your charts:
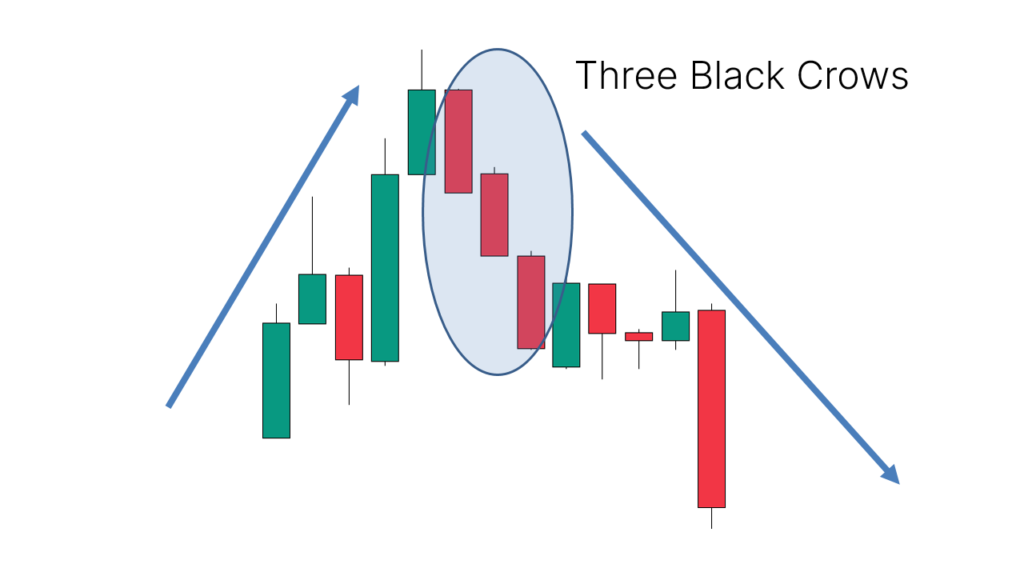
This 3-candle bearish candlestick pattern is a reversal pattern, meaning that it’s used to find tops.
For this reason, we want to see this pattern after a move to the upside, showing that bears are starting to take control.
The success rate of this pattern is 79%.
When a Three Black Crows candlestick pattern appears at the right location, it may show:
- The end of an uptrend and start of a downtrend
- The end of a pullback, resuming a downtrend
Here’s an example of a chart showing a trend reversal after a Three Black Crows candlestick pattern appeared:
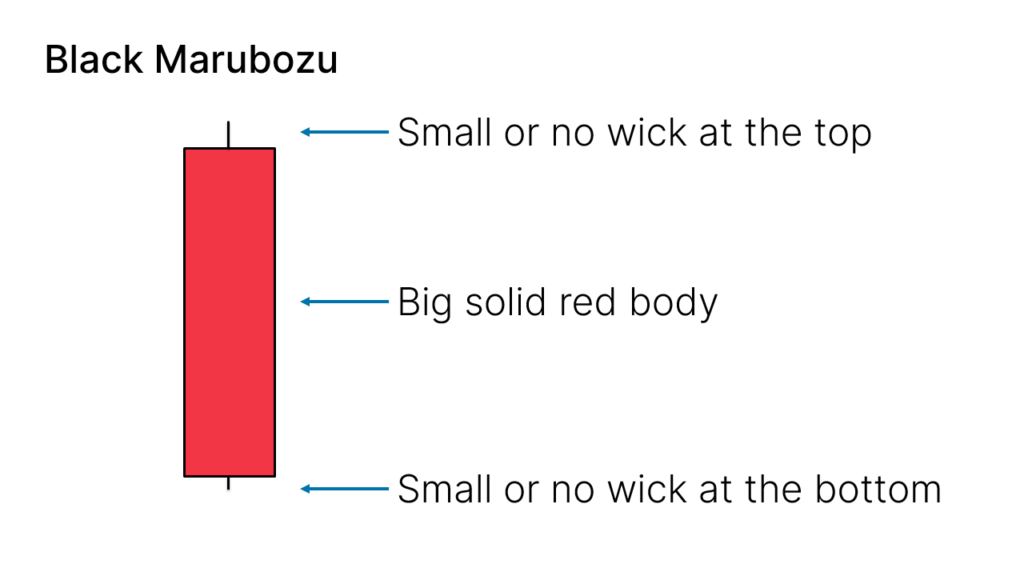
Black Marubozu
The Black Marubozu candlestick pattern is formed by one single candle.
Here’s how to identify the Black Marubozu candlestick pattern:
- One single bearish candle
- The body must be big
- The wicks should be small or non-existent
It looks like this on your charts:
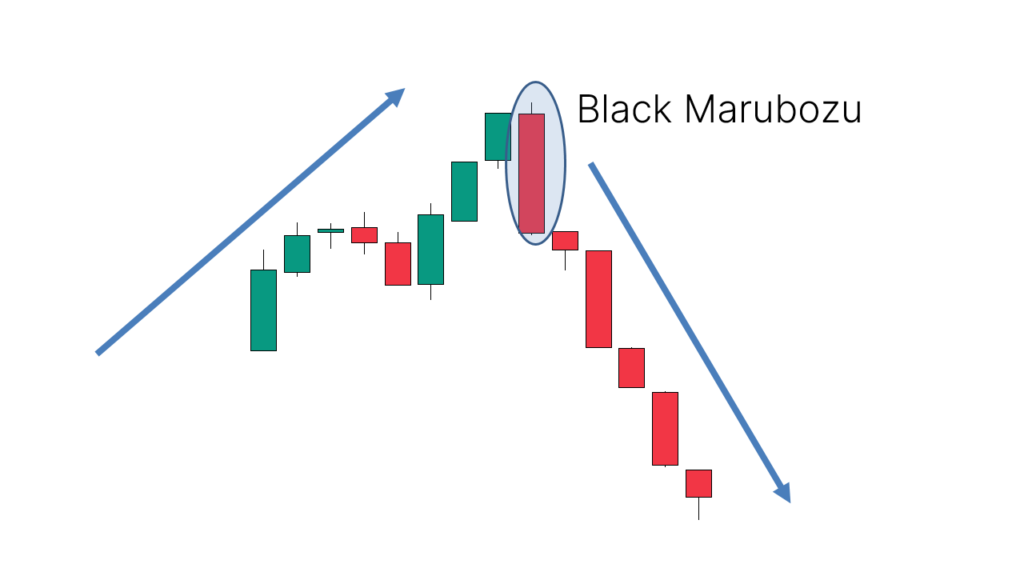
This 1-candle bearish candlestick pattern is a reversal pattern, meaning that it’s used to find tops.
For this reason, we want to see this pattern after a move to the upside, showing that bears are starting to take control.
The success rate of this pattern is 54%.
When a Black Marubozu candlestick pattern appears at the right location, it may show:
- The end of an uptrend and start of a downtrend
- The end of a pullback, resuming a downtrend
Here’s an example of a chart showing a trend reversal after a Black Marubozu candlestick pattern appeared:
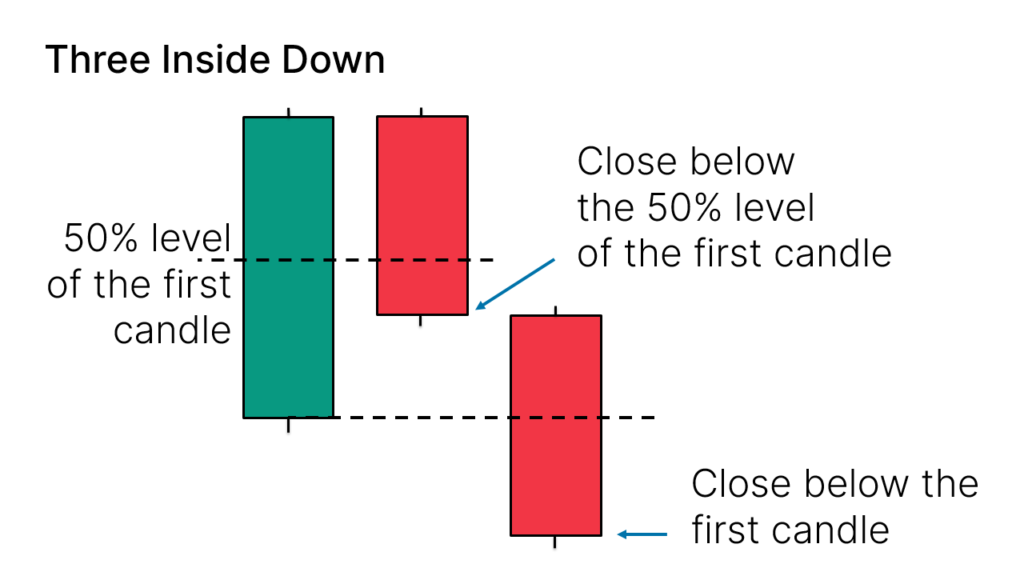
Three Inside Down
The Three Inside Down candlestick pattern is formed by three candles.
Here’s how to identify the Three Inside Down candlestick pattern:
- The first candle must be bullish
- The second candle must be bearish
- The close of the second candle should ideally be below the 50% level of the body of the first one
- The third candle should close below the first one
It looks like this on your charts:
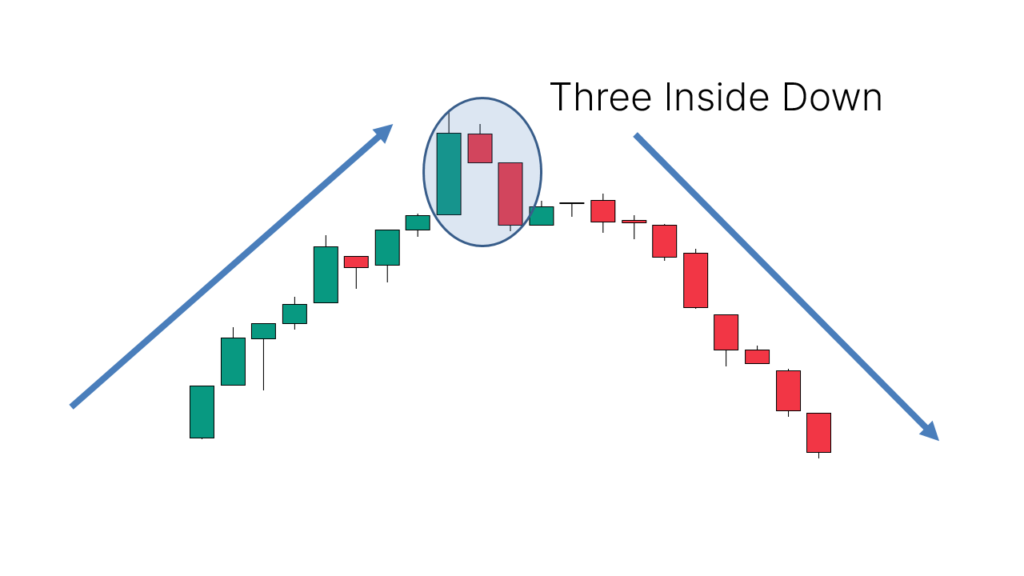
This 3-candle bearish candlestick pattern is a reversal pattern, meaning that it’s used to find tops.
For this reason, we want to see this pattern after a move to the upside, showing that bears are starting to take control.
The success rate of this pattern is 69%.
When a Three Inside Down candlestick pattern appears at the right location, it may show:
- The end of an uptrend and start of a downtrend
- The end of a pullback, resuming a downtrend
Here’s an example of a chart showing a trend reversal after a Three Inside Down candlestick pattern appeared:
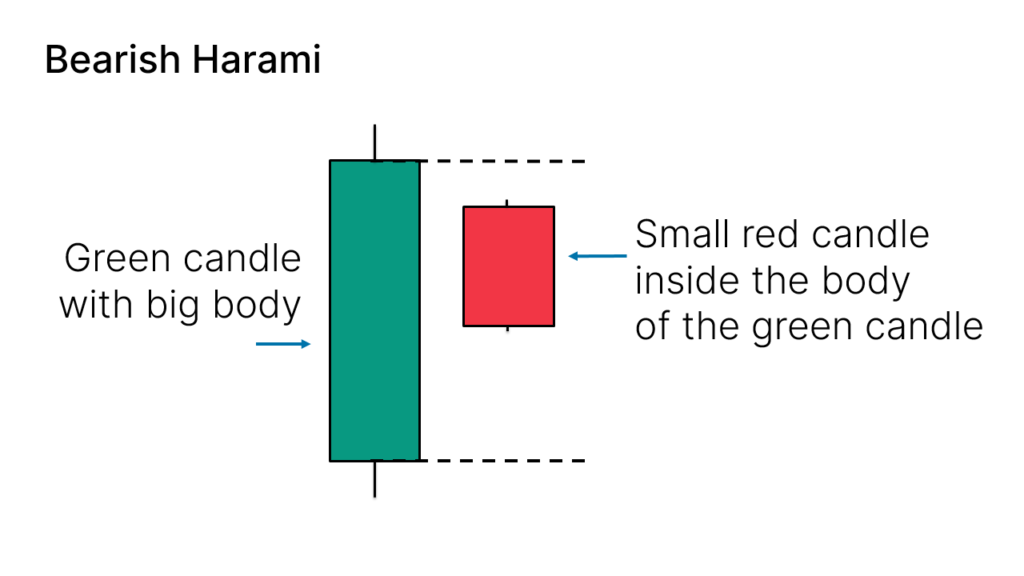
Bearish Harami
The Bearish Harami candlestick pattern is formed by two candles.
Here’s how to identify the Bearish Harami candlestick pattern:
- The first candle must be bullish and have a big body
- The second candle must be small and bearish
- The second candle is inside the body of the first candle
It looks like this on your charts:
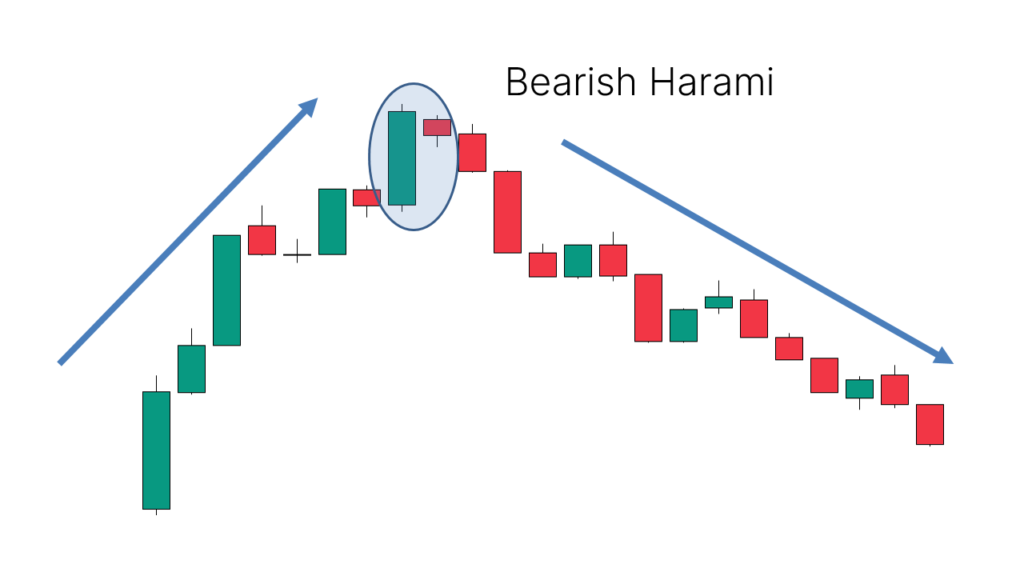
This 3-candle bearish candlestick pattern is a reversal pattern, meaning that it’s used to find tops.
For this reason, we want to see this pattern after a move to the upside, showing that bears are starting to take control.
The success rate of this pattern is 53%.
When a Bearish Harami candlestick pattern appears at the right location, it may show:
- The end of an uptrend and start of a downtrend
- The end of a pullback, resuming a downtrend
Here’s an example of a chart showing a trend reversal after a Bearish Harami candlestick pattern appeared:
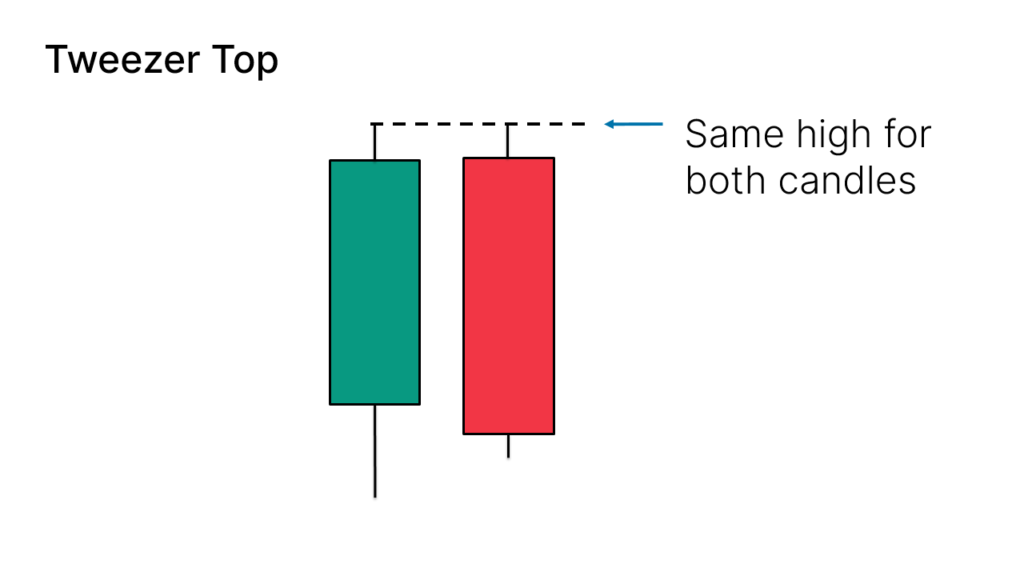
Tweezer Top
The Tweezer Top candlestick pattern is formed by two candles.
Here’s how to identify the Tweezer Top candlestick pattern:
- The first candle is bullish
- The second candle is bearish
- The highs from both candles should be pretty much at the same level
It looks like this on your charts:
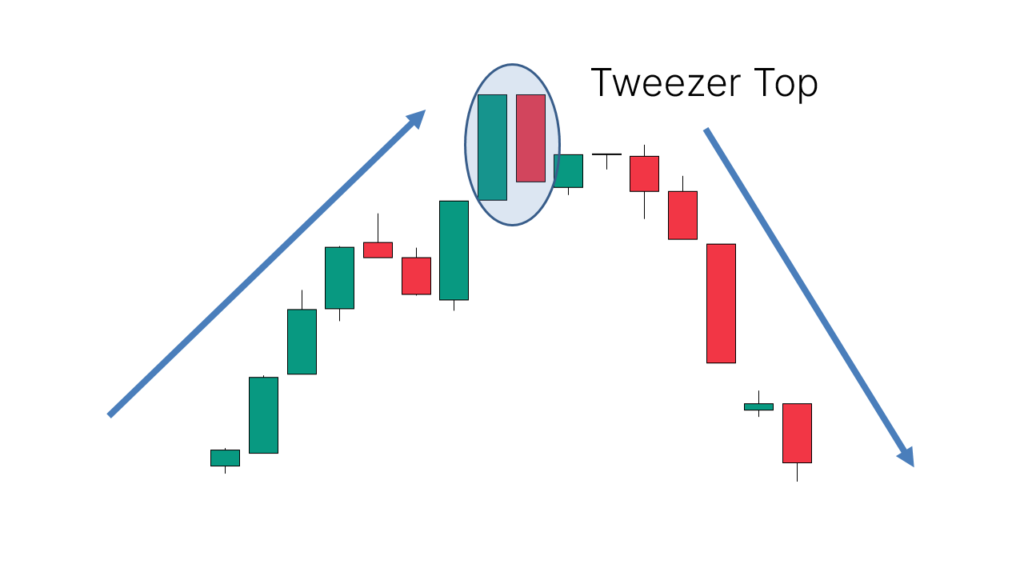
This 2-candle bearish candlestick pattern is a reversal pattern, meaning that it’s used to find tops.
For this reason, we want to see this pattern after a move to the upside, showing that bears are starting to take control.
The success rate of this pattern is 56%.
When a Tweezer Top candlestick pattern appears at the right location, it may show:
- The end of an uptrend and start of a downtrend
- The end of a pullback, resuming a downtrend
Here’s an example of a chart showing a trend reversal after a Tweezer Top candlestick pattern appeared:
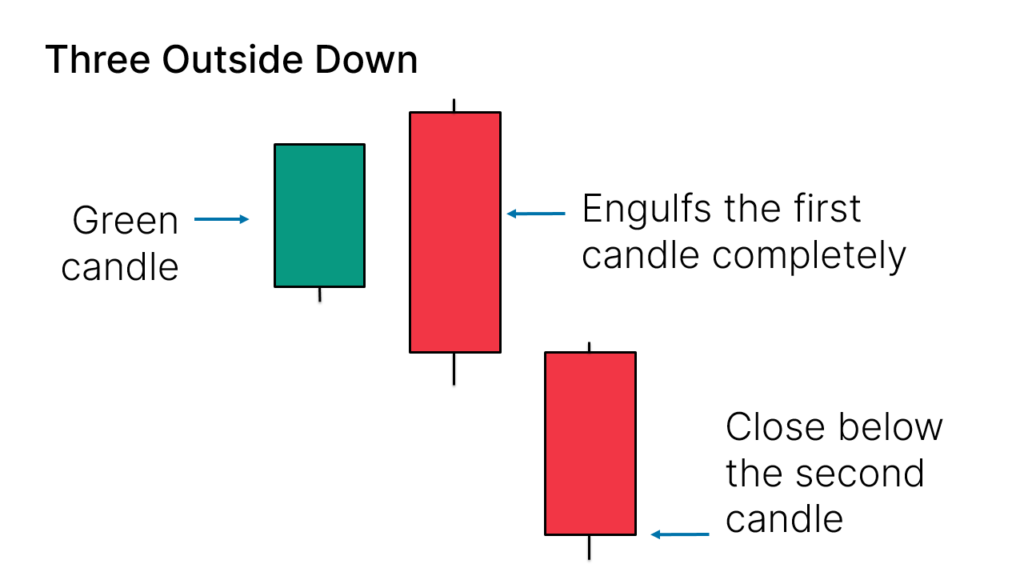
Three Outside Down
The Three Outside Down candlestick pattern is formed by three candles.
Here’s how to identify the Three Outside Down candlestick pattern:
- The first candle is bullish and small
- The second candle is bearish and engulfs the first one completely
- The third candle is bearish and closes below the other ones
It looks like this on your charts:
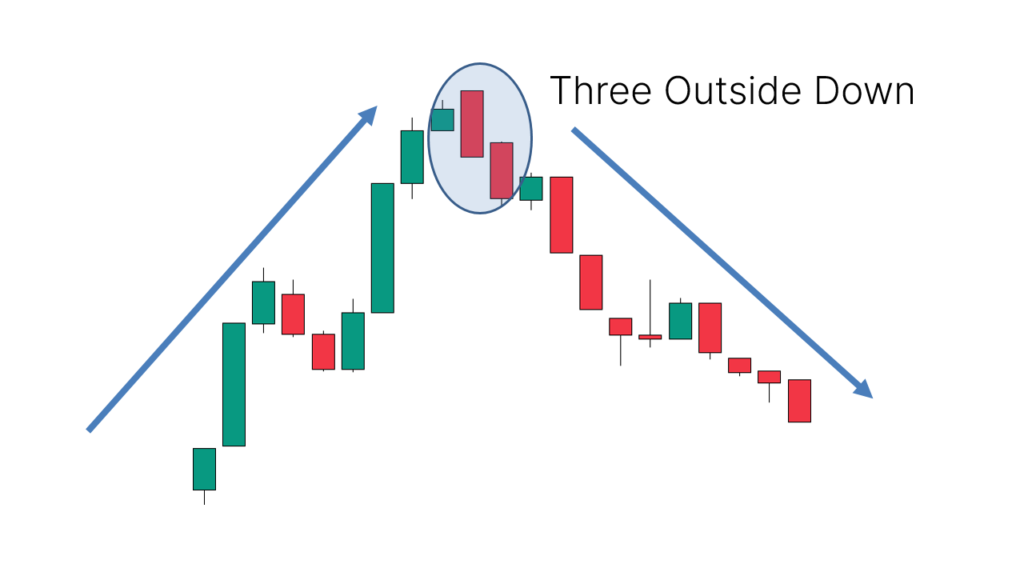
This 3-candle bearish candlestick pattern is a reversal pattern, meaning that it’s used to find tops.
For this reason, we want to see this pattern after a move to the upside, showing that bears are starting to take control.
The success rate of this pattern is 70%.
When a Three Outside Down candlestick pattern appears at the right location, it may show:
- The end of an uptrend and start of a downtrend
- The end of a pullback, resuming a downtrend
Here’s an example of a chart showing a trend reversal after a Three Outside Down candlestick pattern appeared:
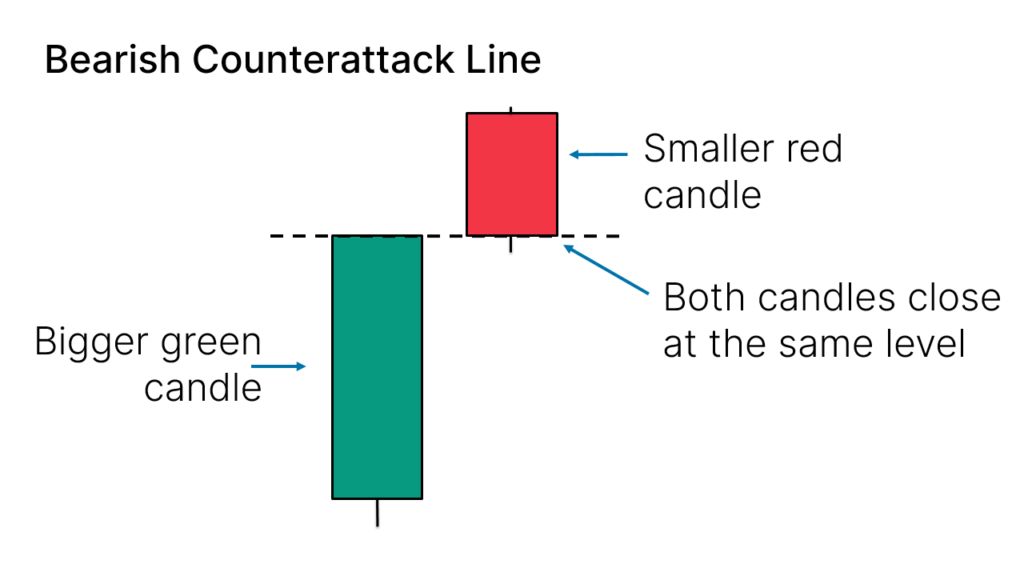
Bearish Counterattack Line
The Bearish Counterattack Line candlestick pattern is formed by two candles.
Here’s how to identify the Bearish Counterattack Line candlestick pattern:
- The first candle is bullish and big
- The second candle is bearish and small
- There’s a gap between the close of the first candle and the open of the second
- They both close at the same level
It looks like this on your charts:
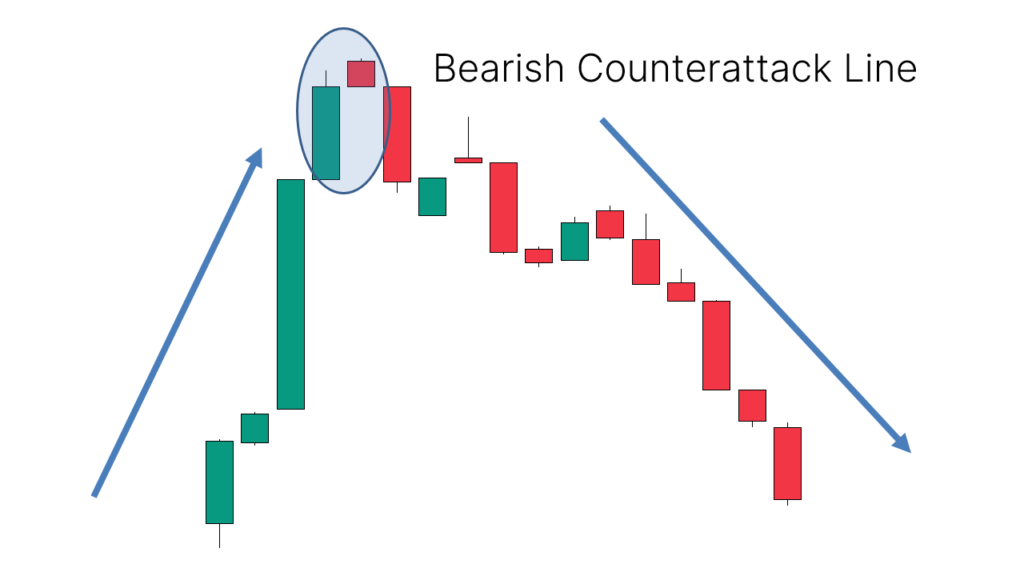
This 2-candle bearish candlestick pattern is a reversal pattern, meaning that it’s used to find tops.
For this reason, we want to see this pattern after a move to the upside, showing that bears are starting to take control.
When a Bearish Counterattack Line candlestick pattern appears at the right location, it may show:
- The end of an uptrend and start of a downtrend
- The end of a pullback, resuming a downtrend
Here’s an example of a chart showing a trend reversal after a Bearish Counterattack Line candlestick pattern appeared:
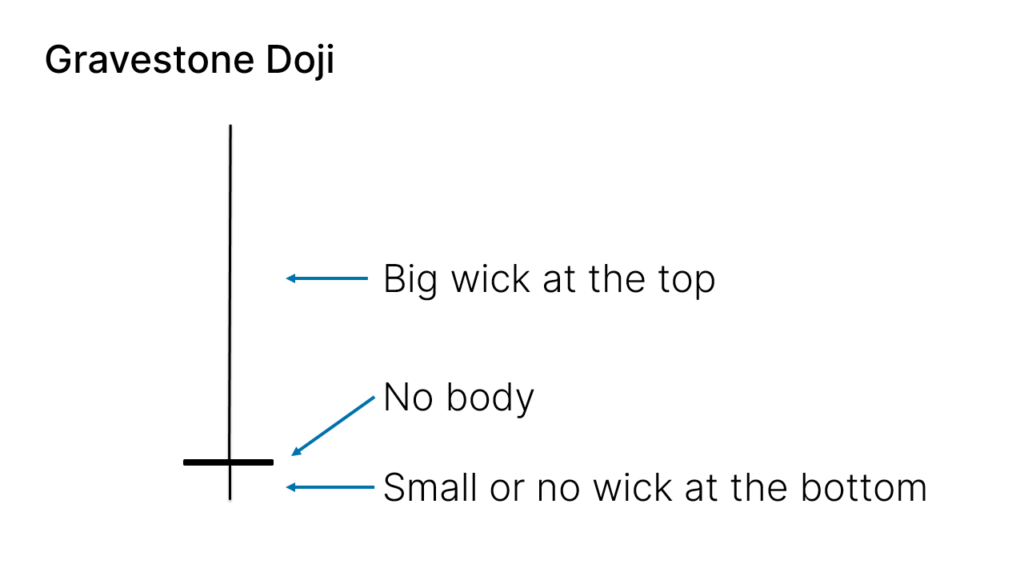
Gravestone Doji
The Gravestone Doji candlestick pattern is formed by one single candle.
Here’s how to identify the Gravestone Doji candlestick pattern:
- The candle has a small body
- The wick at the top must be big
- At the bottom, it should have no wick, or be very small
It looks like this on your charts:
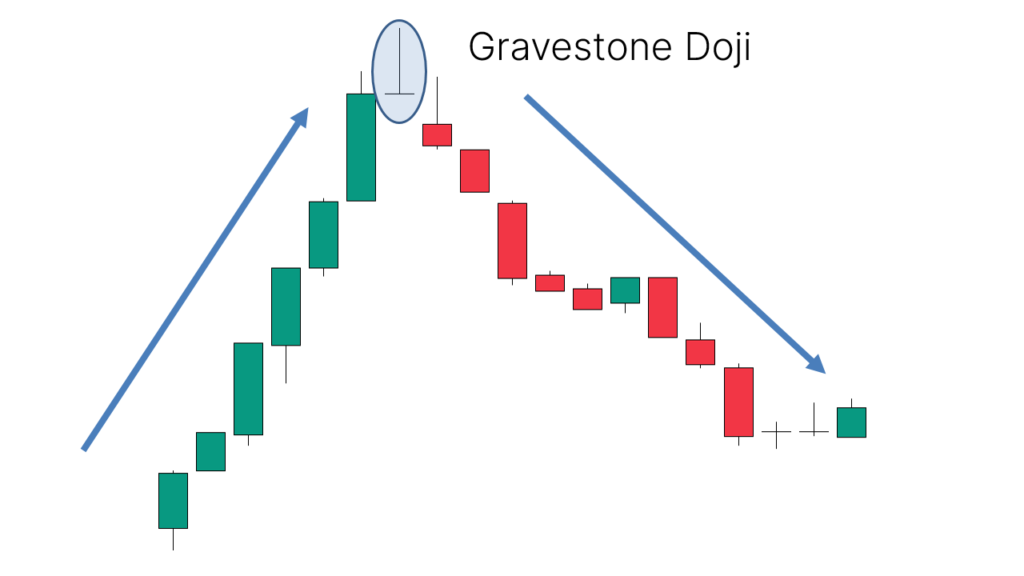
This 1-candle bearish candlestick pattern is a reversal pattern, meaning that it’s used to find tops.
For this reason, we want to see this pattern after a move to the upside, showing that bears are starting to take control.
The success rate of this pattern is 51%.
When a Gravestone Doji candlestick pattern appears at the right location, it may show:
- The end of an uptrend and start of a downtrend
- The end of a pullback, resuming a downtrend
Here’s an example of a chart showing a trend reversal after a Gravestone Doji candlestick pattern appeared:
Bullish Continuation Candlestick Patterns
Bullish continuation candlestick patterns show that buyers are still in control after an upward movement.
They are often used to go long or to add more to long positions.
Here’s an extensive list of them:
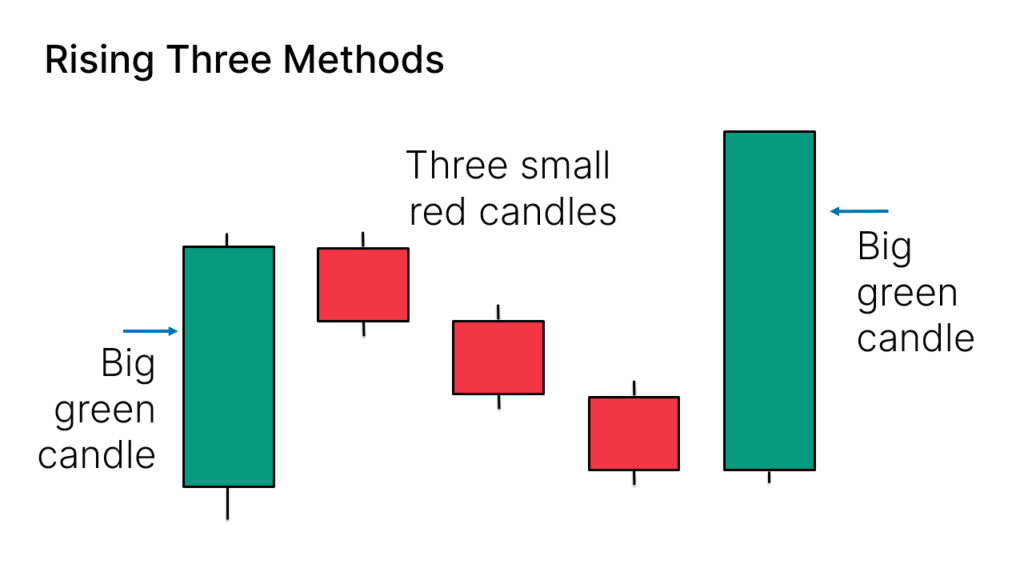
Rising Three Methods
The Rising Three Methods candlestick pattern is formed by five candles.
Here’s how to identify the Rising Three Methods candlestick pattern:
- Initially, you want to see a big green candle
- Followed by three small red candles
- The red candles don’t break the high of the first green candle
- Finally, another big green candle, closing above the other candles
It looks like this on your charts:
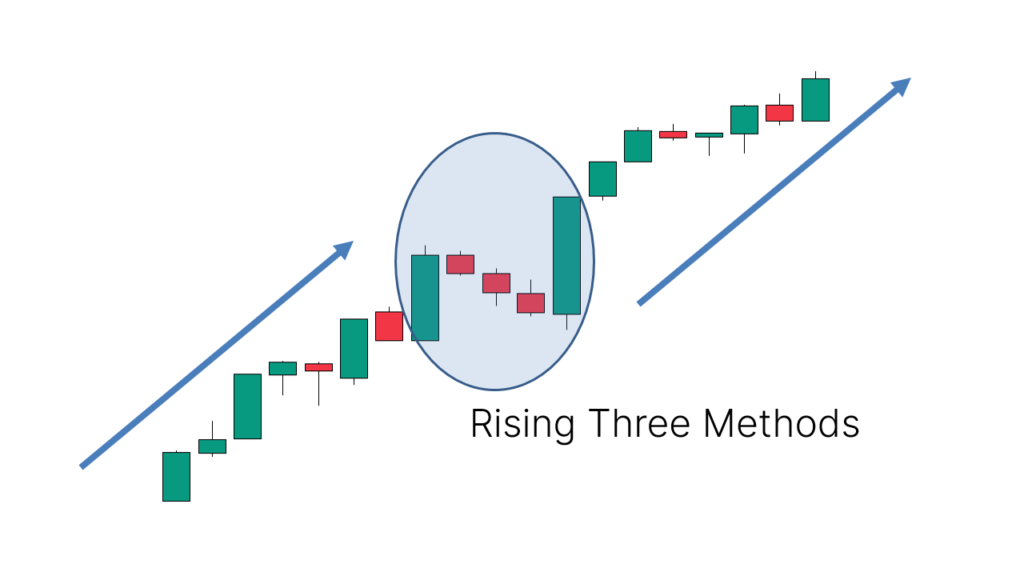
This 5-candle bullish candlestick pattern is a continuation pattern, meaning that it’s used to find entries to go long after pauses during an uptrend.
For this reason, we want to see this pattern after a move to the upside, showing that bulls are starting to take control again.
The success rate of this pattern is 79%.
Here’s an example of a chart showing a continuation move after a Rising Three Methods candlestick pattern appeared:
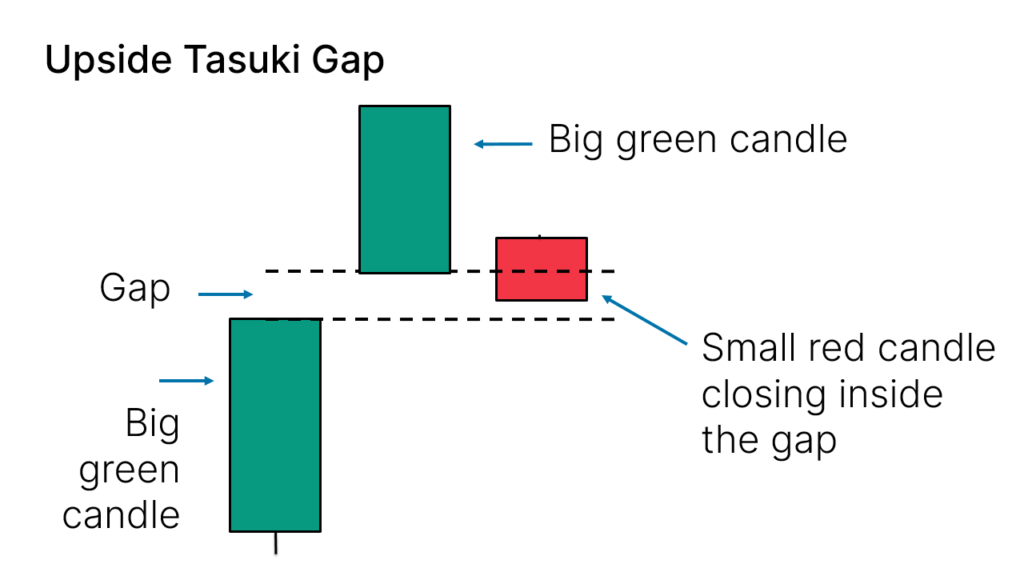
Upside Tasuki Gap
The Upside Tasuki Gap candlestick pattern is formed by three candles.
Here’s how to identify the Upside Tasuki Gap candlestick pattern:
- Two consecutive solid big green candles
- Between both candles, there’s a gap
- Finally, a small red candle will close inside the gap
It looks like this on your charts:
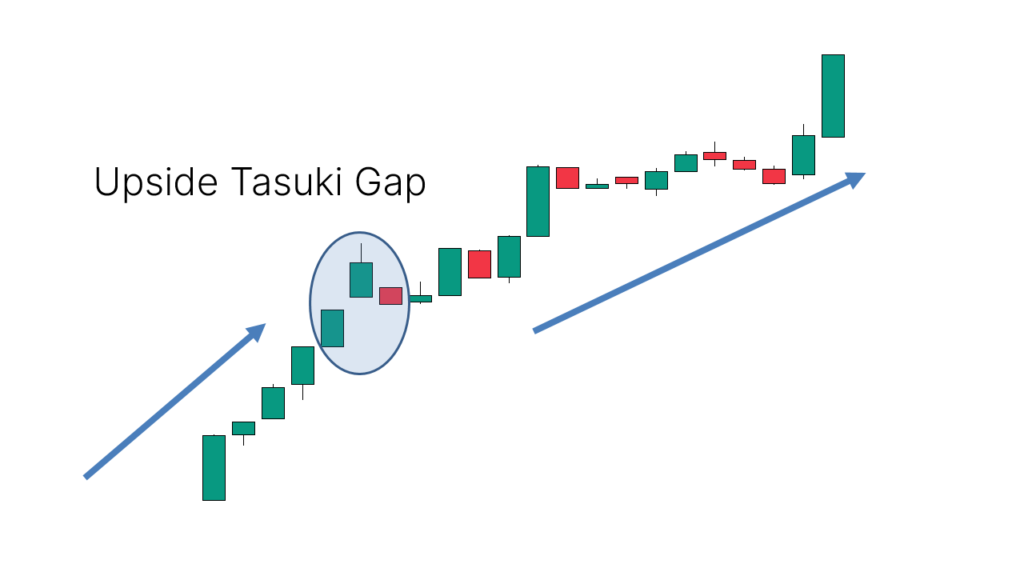
This 3-candle bullish candlestick pattern is a continuation pattern, meaning that it’s used to find entries to go long after pauses during an uptrend.
For this reason, we want to see this pattern after a move to the upside, showing that bulls are starting to take control again.
The success rate of this pattern is 57%.
Here’s an example of a chart showing a continuation move after an Upside Tasuki Gap candlestick pattern appeared:
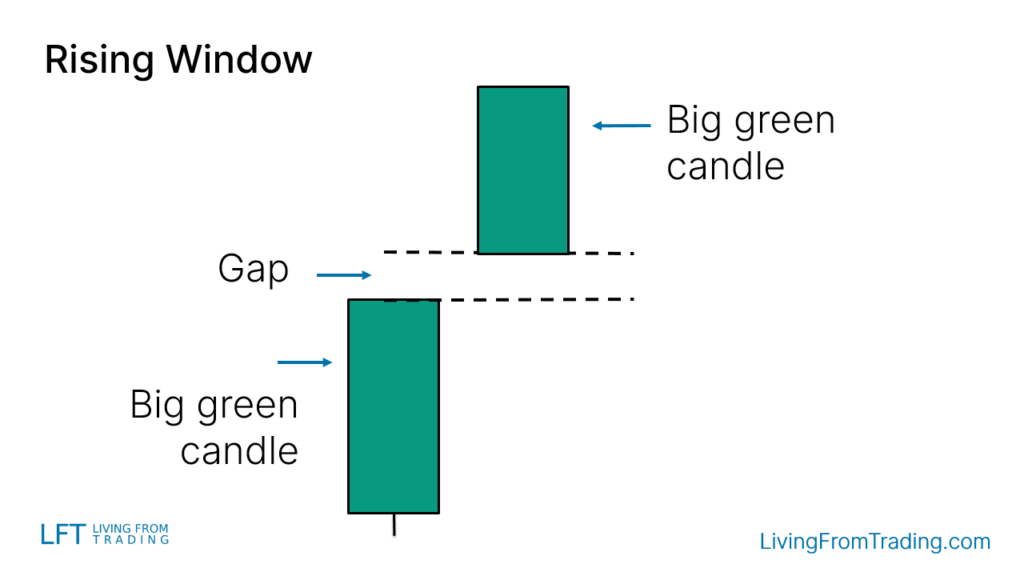
Rising Window
The Rising Window candlestick pattern is formed by two candles.
Here’s how to identify the Rising Window candlestick pattern:
- Two consecutive solid big green candles
- Between both candles, there’s a gap
It looks like this on your charts:
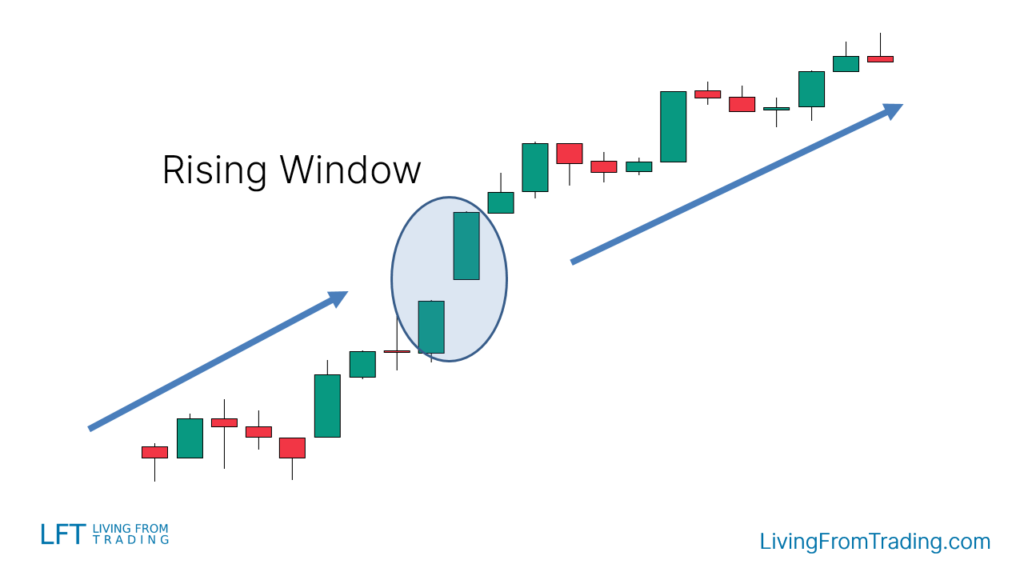
This 2-candle bullish candlestick pattern is a continuation pattern, meaning that it’s used to find entries to go long after pauses during an uptrend.
For this reason, we want to see this pattern after a move to the upside, showing that bulls are starting to take control again.
The success rate of this pattern is 75%.
Here’s an example of a chart showing a continuation move after a Rising Window candlestick pattern appeared:
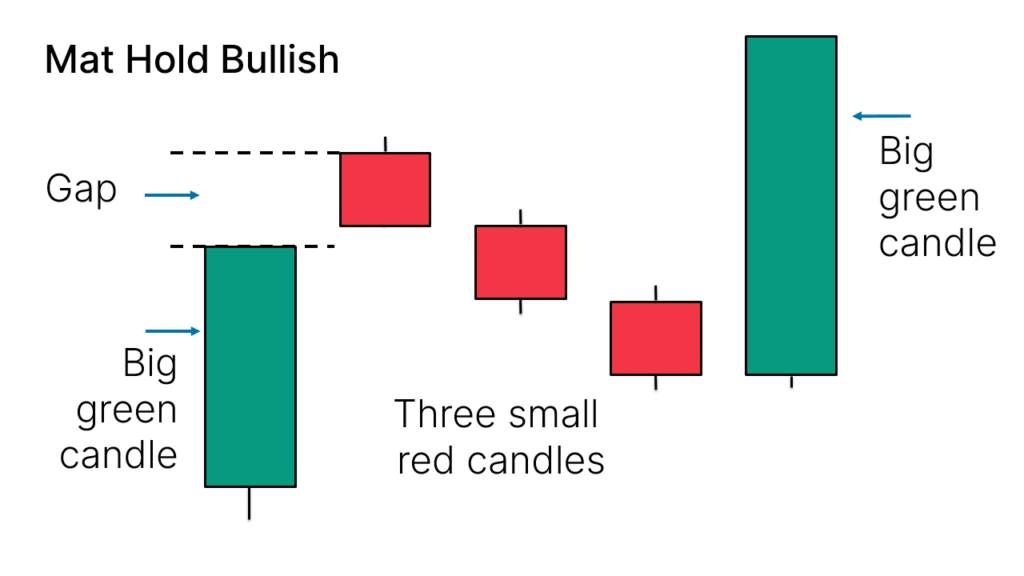
Mat Hold Bullish
The Mat Hold Bullish candlestick pattern is formed by five candles.
Here’s how to identify the Mat Hold Bullish candlestick pattern:
- Initially, you want to see a big green candle
- Followed by a gap and three small red candles
- The red candles don’t break the low of the first green candle
- Finally, another big green candle, closing above the other candles
It looks like this on your charts:
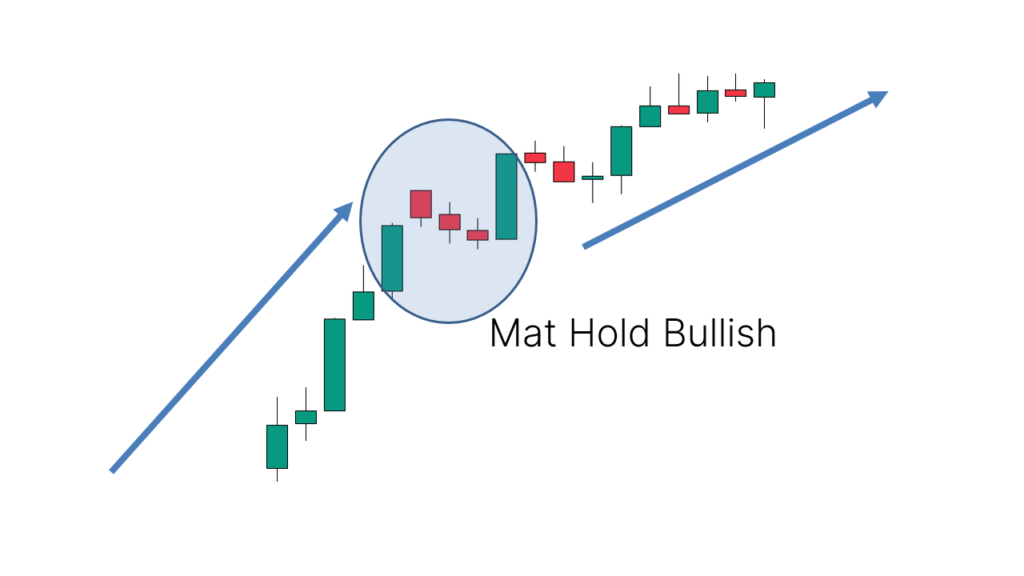
This 5-candle bullish candlestick pattern is a continuation pattern, meaning that it’s used to find entries to go long after pauses during an uptrend.
For this reason, we want to see this pattern after a move to the upside, showing that bulls are starting to take control again.
The success rate of this pattern is 78%.
Here’s an example of a chart showing a continuation move after a Mat Hold Bullish candlestick pattern appeared:
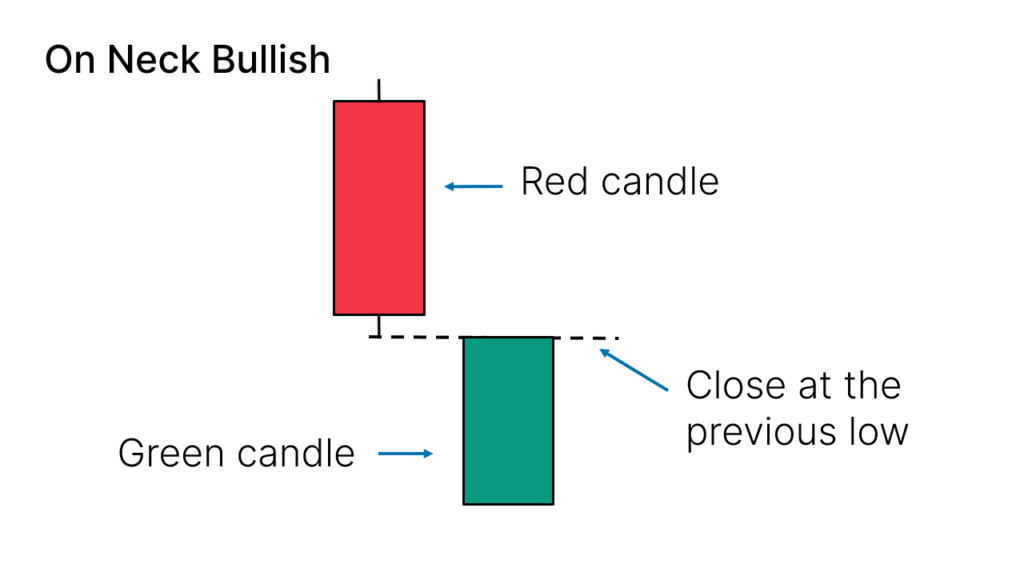
On Neck Bullish
The On Neck Bullish candlestick pattern is formed by two candles.
Here’s how to identify the On Neck Bullish candlestick pattern:
- Initially, you want to see a red candle
- Followed by a gap and one green candle
- The green candle closes at the low of the red candle
It looks like this on your charts:
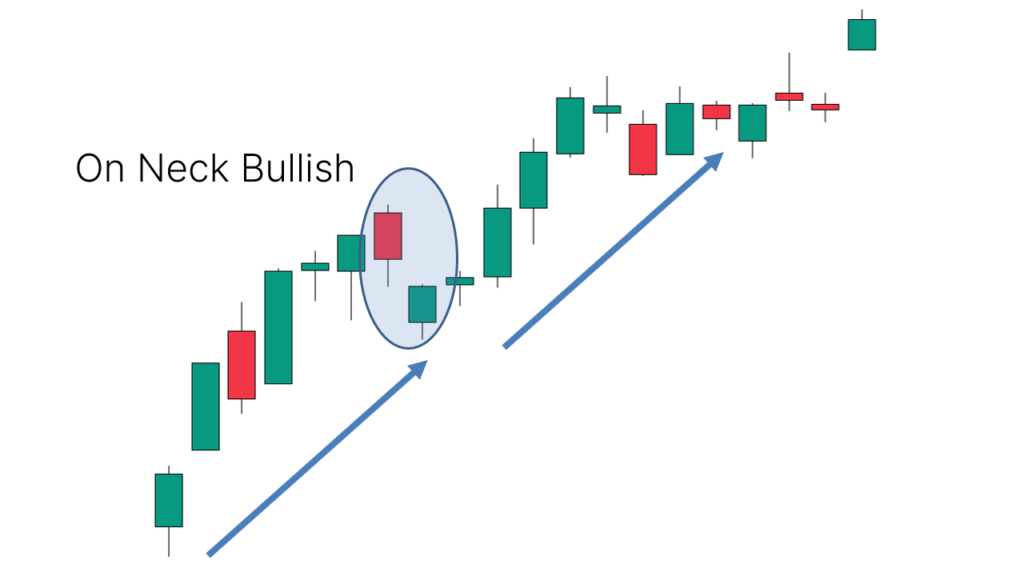
This 2-candle bullish candlestick pattern is a continuation pattern, meaning that it’s used to find entries to go long after pauses during an uptrend.
For this reason, we want to see this pattern after a move to the upside, showing that bulls are starting to take control again.
Here’s an example of a chart showing a continuation move after an On Neck Bullish candlestick pattern appeared:
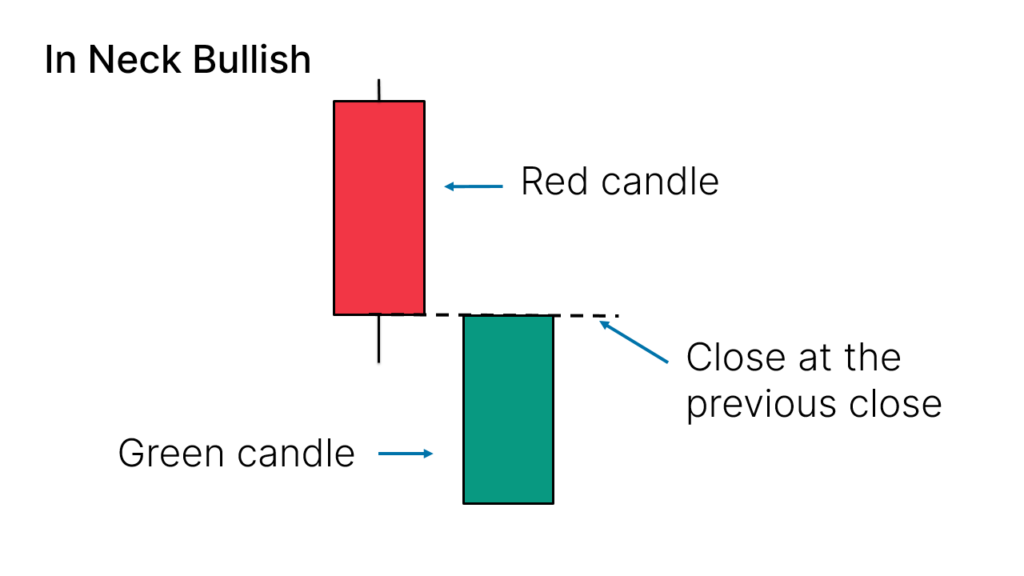
In Neck Bullish
The In Neck Bullish candlestick pattern is formed by five candles.
Here’s how to identify the In Neck Bullish candlestick pattern:
- Initially, you want to see a red candle
- Followed by a gap and one green candle
- The green candle closes at the close level of the red candle
It looks like this on your charts:
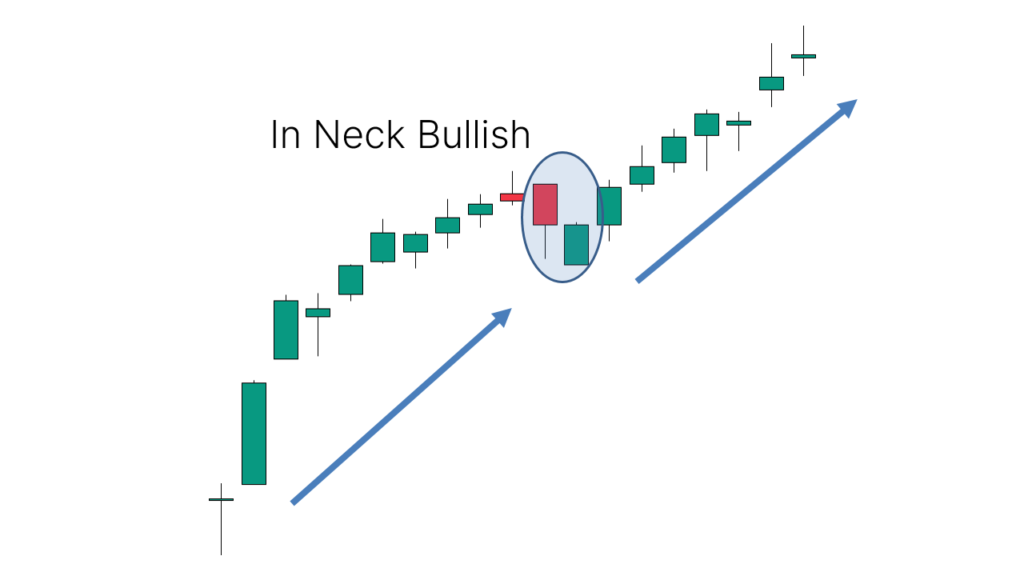
This 2-candle bullish candlestick pattern is a continuation pattern, meaning that it’s used to find entries to go long after pauses during an uptrend.
For this reason, we want to see this pattern after a move to the upside, showing that bulls are starting to take control again.
Here’s an example of a chart showing a continuation move after an In Neck Bullish candlestick pattern appeared:
Bearish Continuation Candlestick Patterns
Bearish continuation candlestick patterns show that sellers are still in control after a downward movement.
They are often used to go short or to add more to short positions.
Here’s an extensive list of them:
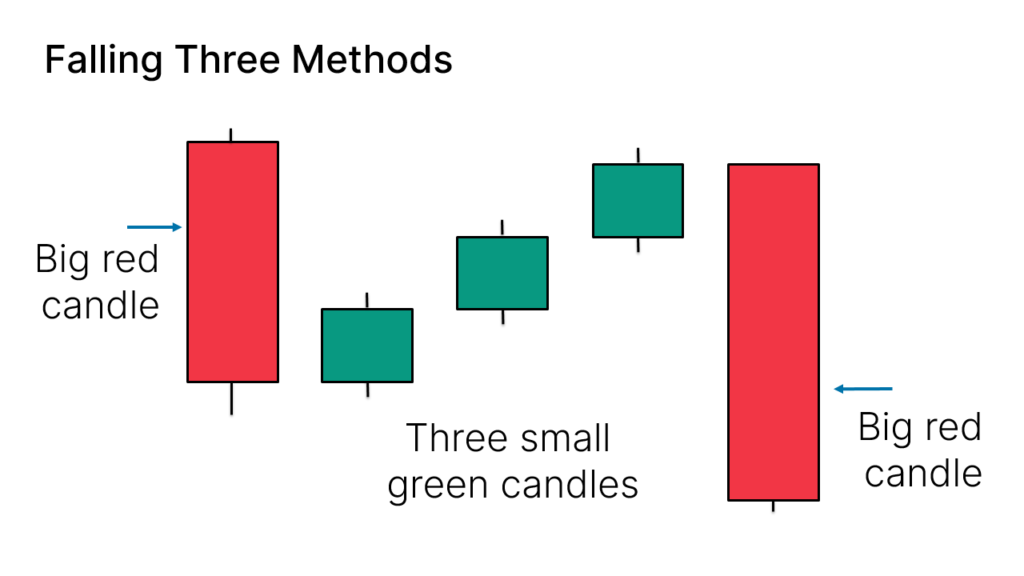
Falling Three Methods
The Falling Three Methods candlestick pattern is formed by five candles.
Here’s how to identify the Falling Three Methods candlestick pattern:
- Initially, you want to see a big red candle
- Followed by three small green candles
- The green candles don’t break the high of the first red candle
- Finally, another big red candle, closing below the other candles
It looks like this on your charts:
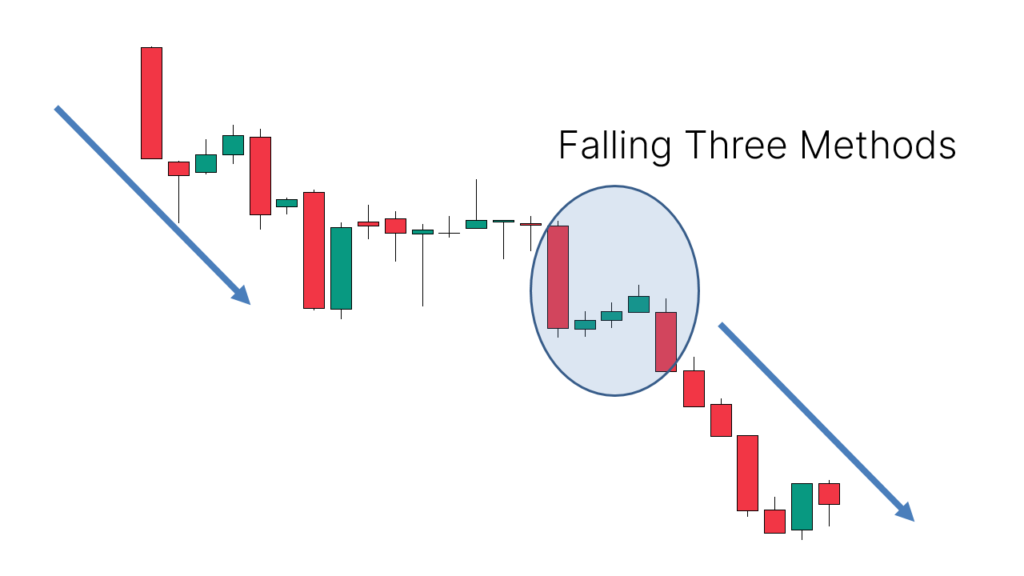
This 5-candle bearish candlestick pattern is a continuation pattern, meaning that it’s used to find entries to short after pauses during a downtrend.
For this reason, we want to see this pattern after a move to the downside, showing that bears are starting to take control again.
The success rate of this pattern is 71%.
Here’s an example of a chart showing a continuation move after a Falling Three Methods candlestick pattern appeared:
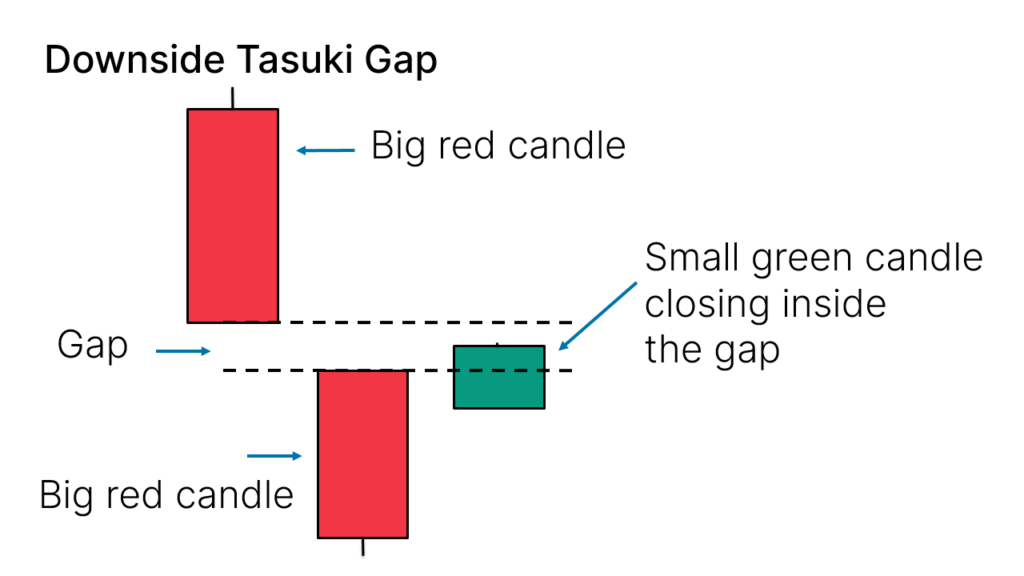
Downside Tasuki Gap
The Downside Tasuki Gap candlestick pattern is formed by three candles.
Here’s how to identify the Downside Tasuki Gap candlestick pattern:
- Two consecutive solid big red candles
- Between both candles, there’s a gap
- Finally, a small green candle will close inside the gap
It looks like this on your charts:
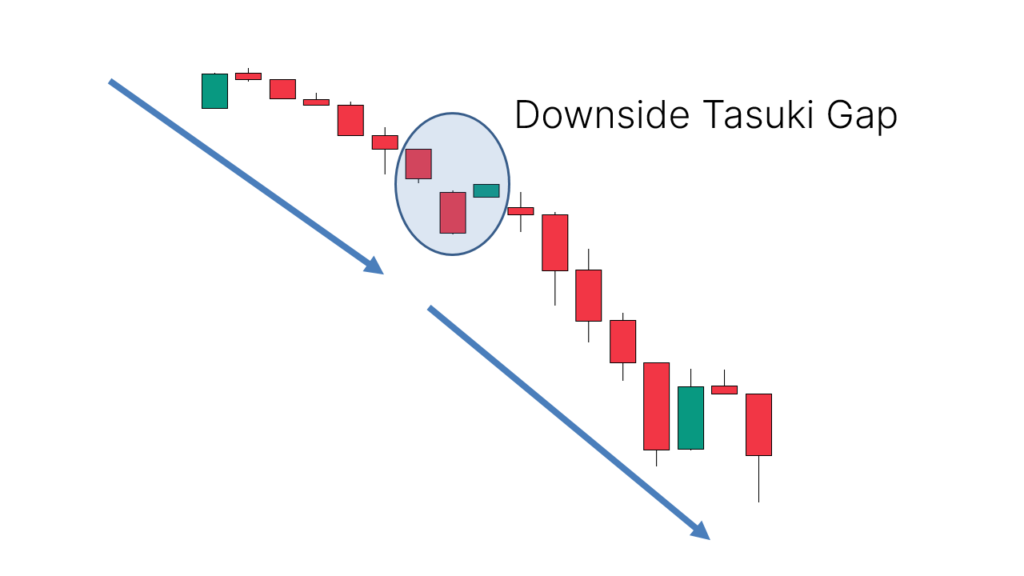
This 3-candle bearish candlestick pattern is a continuation pattern, meaning that it’s used to find entries to short after pauses during a downtrend.
For this reason, we want to see this pattern after a move to the downside, showing that bears are starting to take control again.
The success rate of this pattern is 54%.
Here’s an example of a chart showing a continuation move after a Downside Tasuki Gap candlestick pattern appeared:
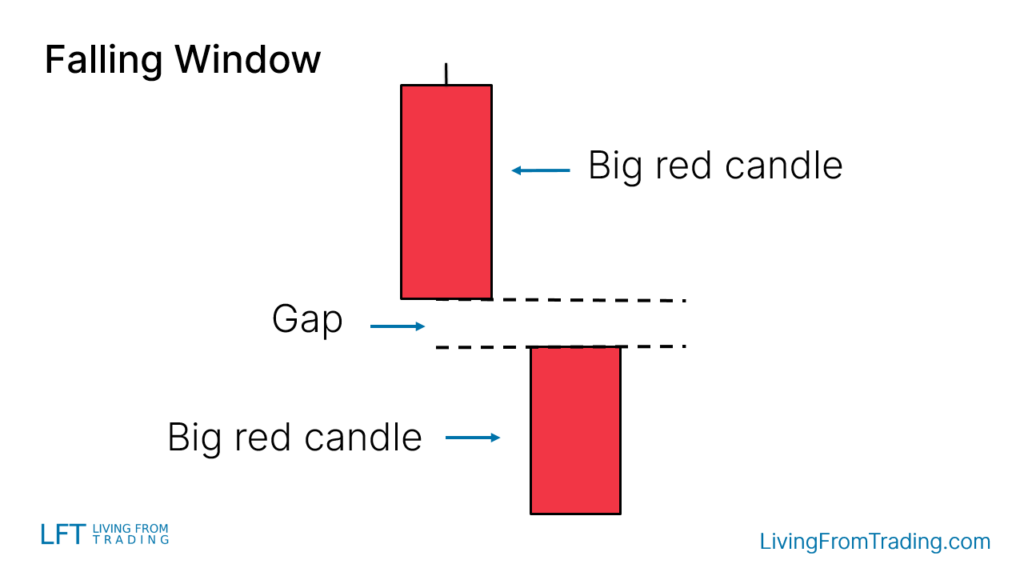
Falling Window
The Falling Window candlestick pattern is formed by two candles.
Here’s how to identify the Falling Window candlestick pattern:
- Two consecutive solid big red candles
- Between both candles, there’s a gap
It looks like this on your charts:
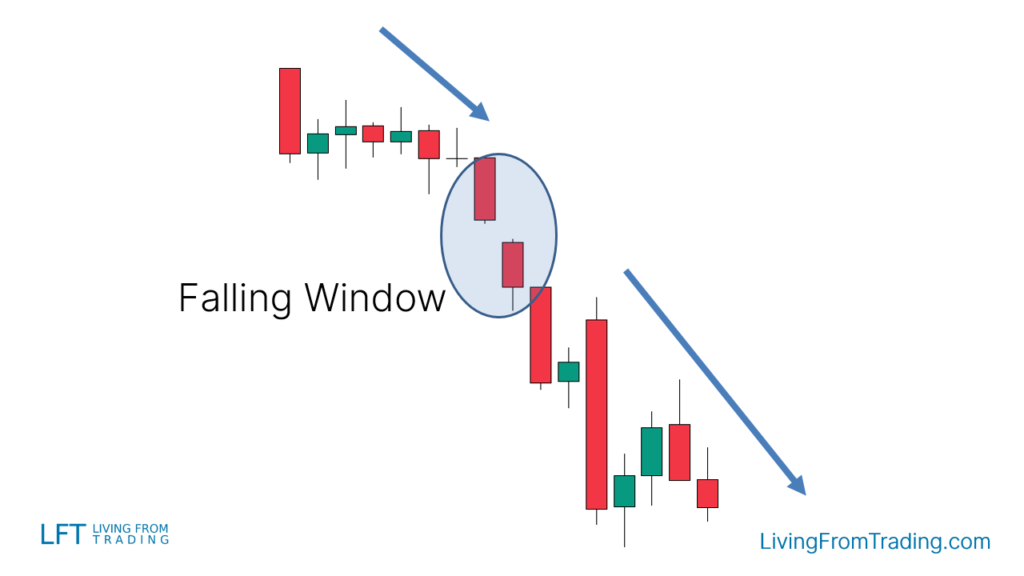
This 2-candle bearish candlestick pattern is a continuation pattern, meaning that it’s used to find entries to short after pauses during a downtrend.
For this reason, we want to see this pattern after a move to the downside, showing that bears are starting to take control again.
The success rate of this pattern is 73%.
Here’s an example of a chart showing a continuation move after a Falling Window candlestick pattern appeared:
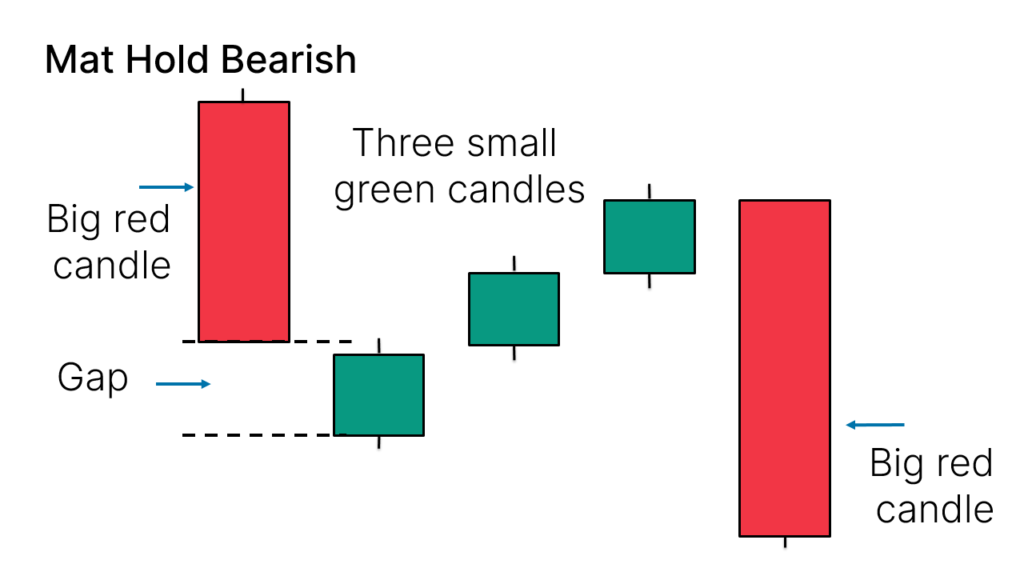
Mat Hold Bearish
The Mat Hold Bearish candlestick pattern is formed by five candles.
Here’s how to identify the Mat Hold Bearish candlestick pattern:
- Initially, you want to see a big red candle
- Followed by a gap and three small green candles
- The green candles don’t break the high of the first red candle
- Finally, another big red candle, closing below the other candles
It looks like this in your charts:
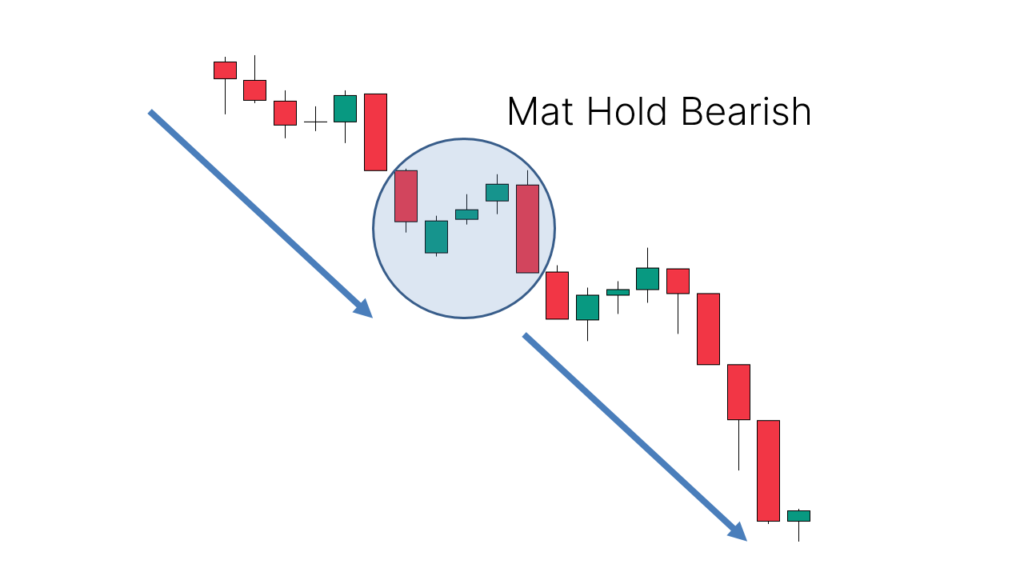
This 5-candle bearish candlestick pattern is a continuation pattern, meaning that it’s used to find entries to short after pauses during a downtrend.
For this reason, we want to see this pattern after a move to the downside, showing that bears are starting to take control again.
Here’s an example of a chart showing a continuation move after a Mat Hold Bearish candlestick pattern appeared:
On Neck Bearish
The On Neck Bearish candlestick pattern is formed by five candles.
Here’s how to identify the On Neck Bearish candlestick pattern:
- Initially, you want to see a green candle
- Followed by a gap and one red candle
- The red candle closes at the high of the green candle
It looks like this on your charts:
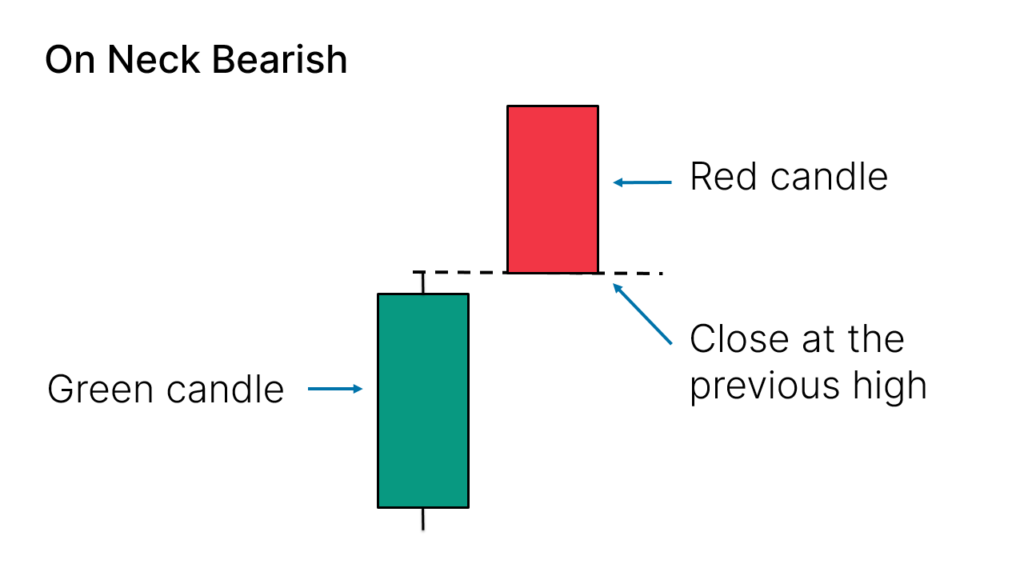
This 2-candle bearish candlestick pattern is a continuation pattern, meaning that it’s used to find entries to short after pauses during a downtrend.
For this reason, we want to see this pattern after a move to the downside, showing that bears are starting to take control again.
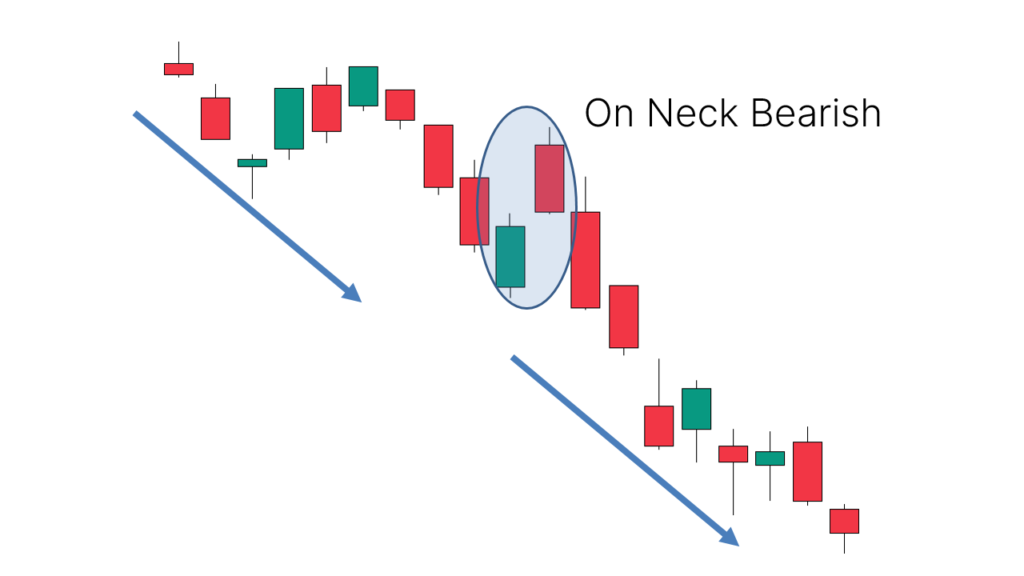
Here’s an example of a chart showing a continuation move after an On Neck Bearish candlestick pattern appeared:
In Neck Bearish
The In Neck Bearish candlestick pattern is formed by five candles.
Here’s how to identify the In Neck Bearish candlestick pattern:
- Initially, you want to see a green candle
- Followed by a gap and one red candle
- The red candle closes at the close level of the green candle
It looks like this on your charts:
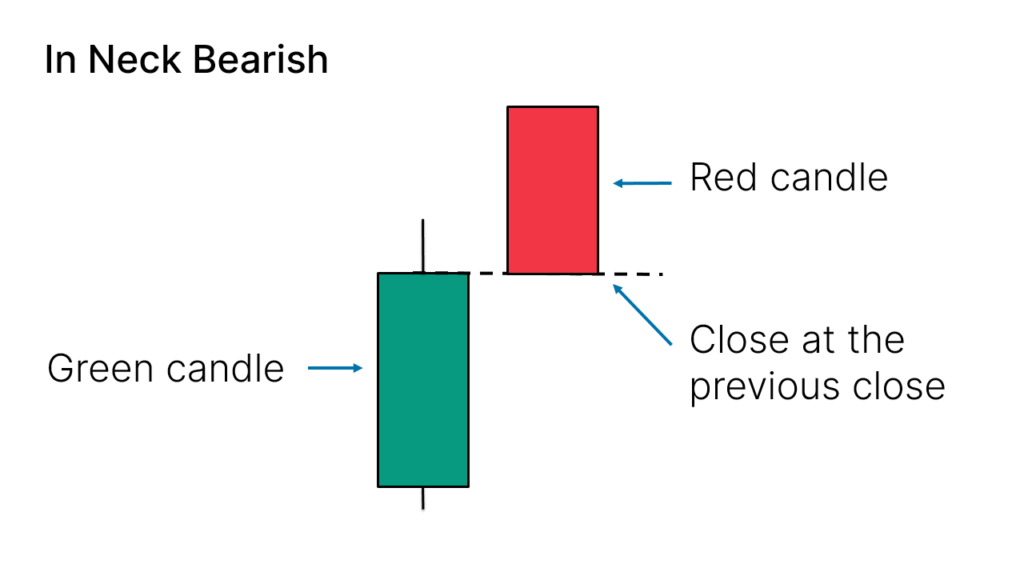
This 2-candle bearish candlestick pattern is a continuation pattern, meaning that it’s used to find entries to short after pauses during a downtrend.
For this reason, we want to see this pattern after a move to the downside, showing that bears are starting to take control again.
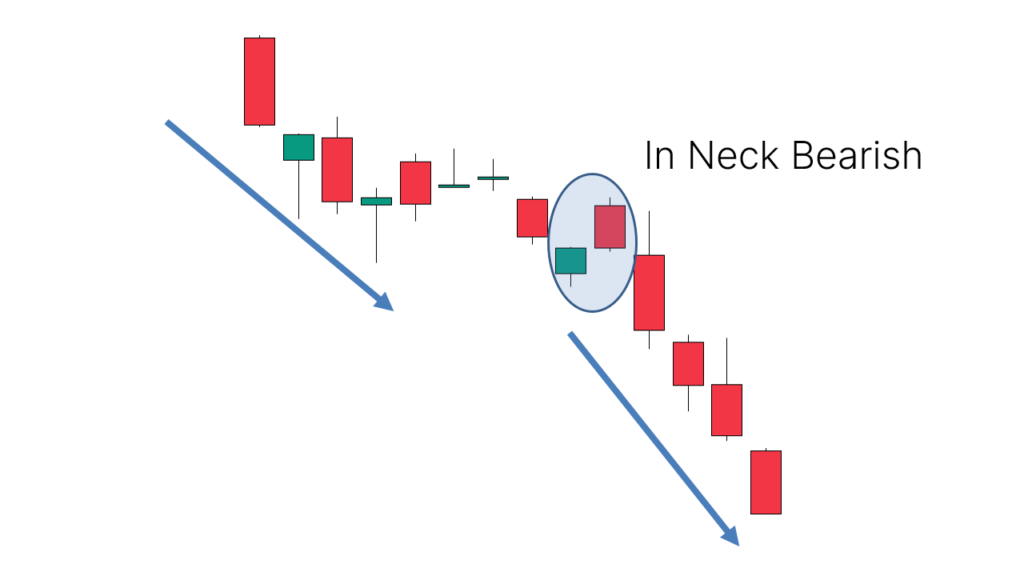
Here’s an example of a chart showing a continuation move after an In Neck Bearish candlestick pattern appeared:
Indecision Candlestick Patterns
Indecision candlestick patterns show exactly what the name suggests, times when the market is undecided about where to go.
For this reason, when you see them, it’s a good practice to stay away and wait for clear price action showing a move starting in some direction.
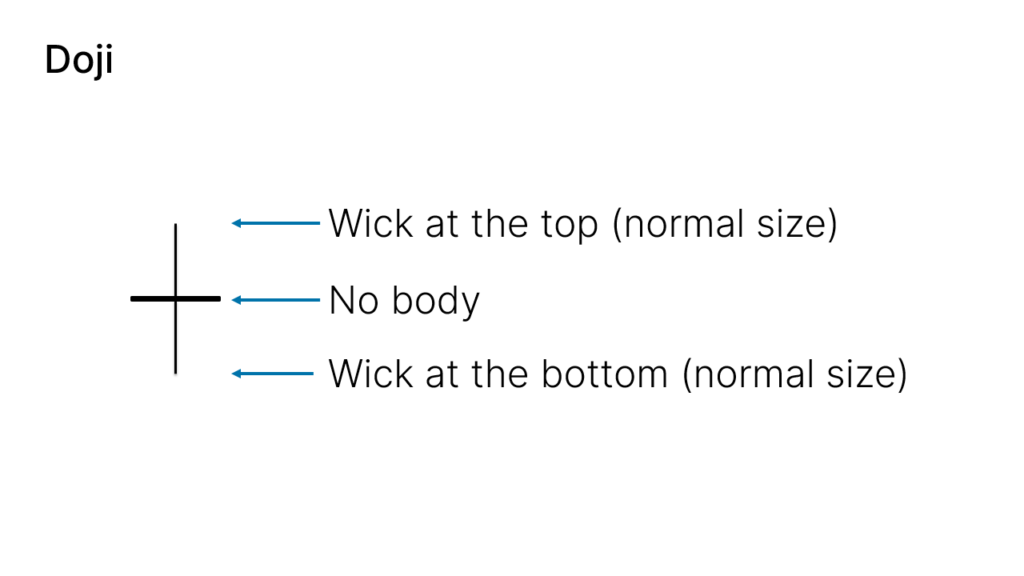
Doji
The Doji candle is formed by one single candle.
Here’s how to identify the Doji candlestick pattern:
- A candle doesn’t have a body or is very small like 1-tick sized
- It has wicks above and below, although not big sized
It looks like this on your charts:
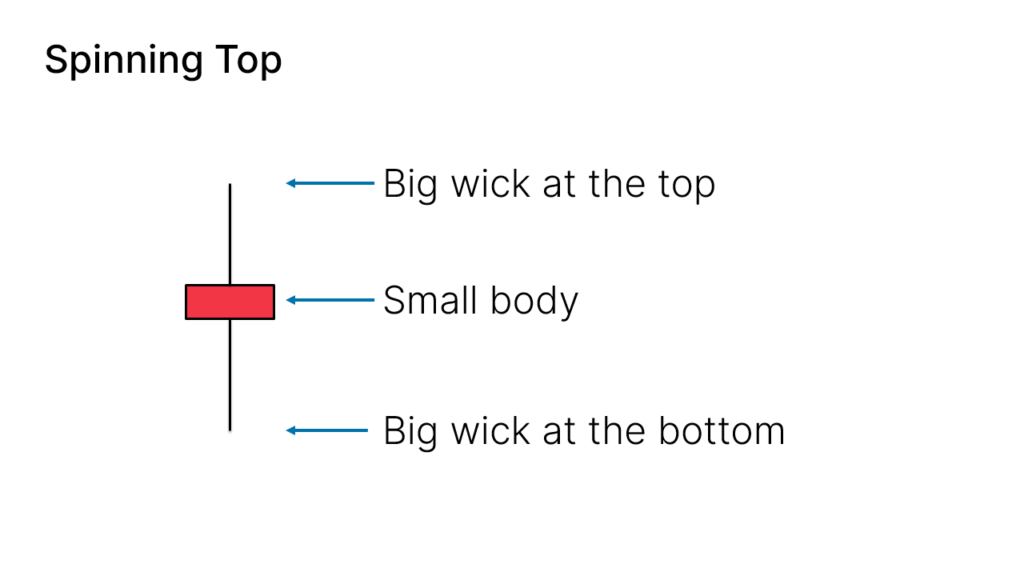
Spinning Top
The Spinning Top candlestick pattern is formed by one single candle.
Here’s how to identify the Spinning Top candlestick pattern:
- A candle with a very small body
- It has big wicks above and below
It looks like this on your charts:
High Wave
The High Wave candlestick pattern is formed by one single candle.
Here’s how to identify the High Wave candlestick pattern:
- A candle with a very small body
- It has very big wicks above and below
It looks like this on your charts:
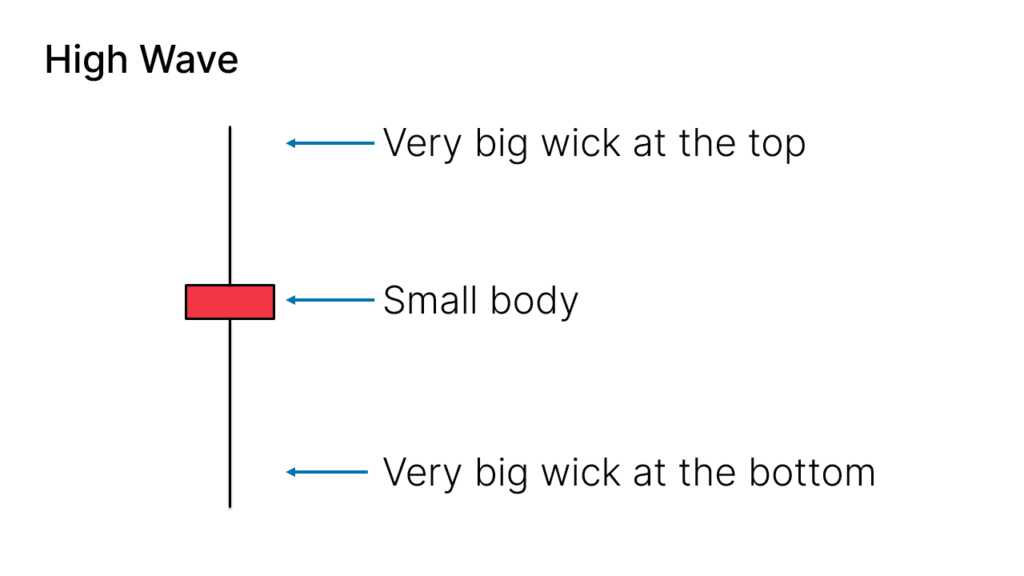
If it looks similar to the Spinning Top pattern, that’s because it is.
The only difference between them is the size of the wicks. In the High Wave pattern, they are abnormally bigger.
This is what you learned today
- Candlestick patterns can be bearish or bullish depending if they are anticipating a bear or bull market move.
- Candlestick patterns can be of continuation or reversal depending if they are anticipating a continuation of the trend or a trend change.
- Some candlestick patterns mean that the market is undecided, and we should stay away from trading until a clear direction appears.
If you want to learn more about these patterns and their success rate in different scenarios, here’s the book that you should read.
Now I want to hear from you.
What’s your favorite candlestick pattern and why?
Let me know in the comments below.