
Indices are one of the best markets to trade.
Their charts are much clearer than forex charts.
And you know what?
They trend a lot!
That makes them perfect for strategies that follow trends.
But first, let’s start to understand:
What is an index?
An Index is just a way of measuring the value of a certain group of stocks.
In a very simple way, imagine that you choose a bunch of companies and calculate the average of their shares price.
The value that you get is the index for that group of stocks.
But not all indices are calculated the same way.
Each company shares price may have a different weight on the calculated average.
This means that big-sized companies may have a bigger influence on the index value, than small-sized companies.
What types of indices exist?
Each index measures a group of the stock market.
Usually, the group is a country but it can be just an industry sector, like technology or industrial.
Here are the most popular:
- Dow Jones (DJ 30), also known as Dow Jones Industrial Average, is made up of the 30 biggest industrial companies in the U.S.
- S&P 500, it’s the biggest index in the world. It represents 500 companies from the U.S.
- NASDAQ 100, measures the 100 major tech companies in the U.S.
- DAX 30, it’s the German index. It includes the 30 leading German companies.
- FTSE 100, groups the top 100 companies of the U.K.
- CAC 40, represents the best 40 French companies.
- NIKKEI 225, it’s the index from Japan. It contains the 225 biggest companies in the country.
What makes the indices price move?
Traditionally, on a market like forex or stocks, the prices are set based on the number of buyers and sellers.
But that’s not the case when we are talking about indices.
That’s because indices are not really a market, they are just a value that represents the average share price of a group of companies.
This means that the index price will move based on the stock price movement of the companies that are represented by each index, not by the imbalance between the actual buyers and sellers of the index.
An example considering NASDAQ index and the companies that are represented by this index, like Apple (#AAPL), Facebook (#FB), Microsoft (#MSFT), Netflix (#NFLX) and all the others.
If the prices of these companies stocks are dropping, then NASDAQ price will also go down. Regardless of the number of people buying or selling NASDAQ.
Now an example of the stocks that make up DAX, like Adidas (#ADS), Basf (#BASF), Deutsche Bank (#DTE), Volkswagen (#VOW), and all the others.
If the stock prices of these companies increase, the DAX price will rise.
Even if all the traders are selling DAX, if the stock prices of the companies that compound the DAX index are going up, then the DAX price will increase.
Even if Jesus Christ himself comes and sells DAX, its price will still go up!
It doesn’t matter how many buyers and sellers are trading an index, whether is DAX, Dow Jones, or NASDAQ… Their price will move according to the buyers and sellers that are trading the companies’ stocks, not the index itself.
Why are indices good to trade?
Indices usually have high volatility, especially when the markets of the index country open.
And volatility is good, although a lot of traders are not comfortable with it.
Volatility makes the price actually move with conviction, reducing the noise.
Decreasing a big amount of fake signals.
And that means fewer stop losses hit, and more profitable trades with higher returns.
Look at this example.
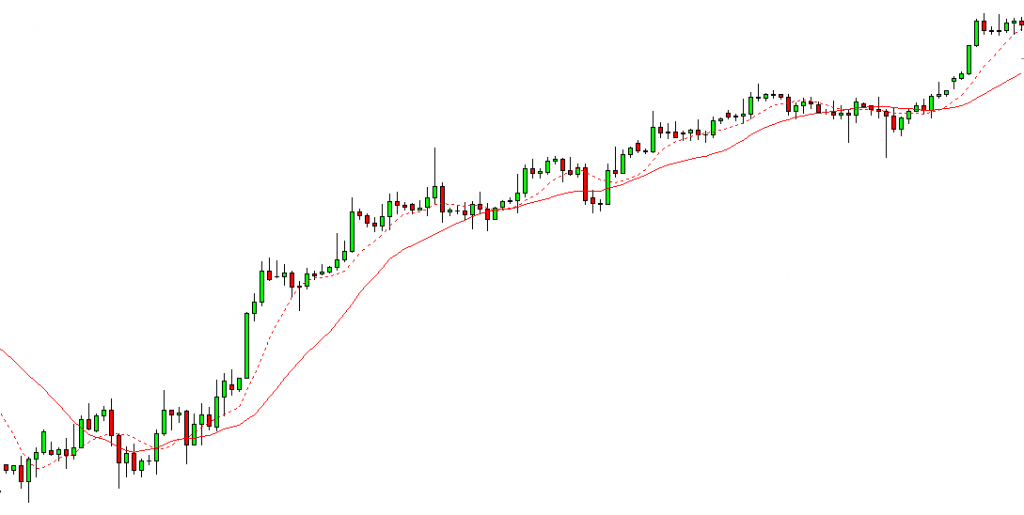
This is a DAX chart.
It represents one entire month in a 4-hour time frame.
Look how beautiful it trends.
Depending on your trading style, there could be a better time frame for you.
All these trends appear in all time frames. You get amazing trends on higher time frames.
But you also get them when day trading, during the day.
Check this example, this is 5 hours of DAX on an M2 time frame, during the day.
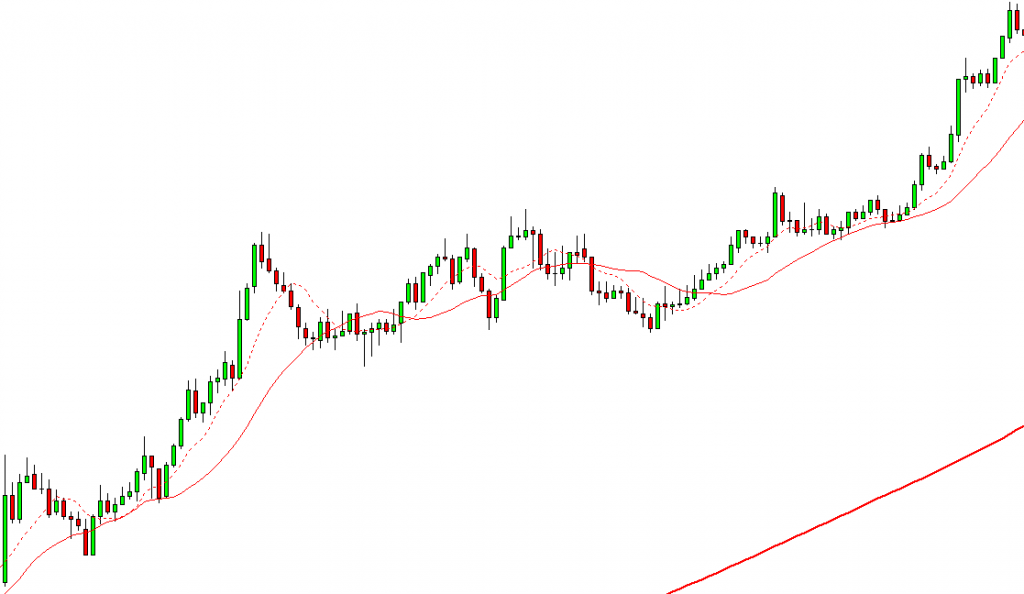
If you know how to trade during trends you can for sure understand how great this trend is.
This is constantly happening, day after day.
This is a 2-minute time frame!
Where on a forex pair, can you get such beautiful and profitable movements during a whole day in such a low time frame?
Without any noise?
This is the power of indices trading!
And that’s why we love to trade them every day in the LFT trading room.
How to make money trading indices?
Indices are traded the exact same way as forex or stocks.
Ideally, you want to trade with leverage, specially if you are day trading or scalping.
You open a trade in one direction and you earn money if the price goes in that direction.
If the price comes against you, then you may lose money.
Since indices trend a lot, the best strategies to trade them are trend follow strategies.
I like to use moving averages in my trading system.
When the price is trending, I wait for a pullback on the moving averages.
At that point, I wait for the price to start to recover from the pullback.
Start moving in the trend direction.
When I see that, that’s where I open my trades.
And then I just need to leave the price move.
Most of the time it goes in my trade direction.
And after it makes a new peak, that’s time to close the trade and put some money in the pocket.
Look at a great example of a quick trade.
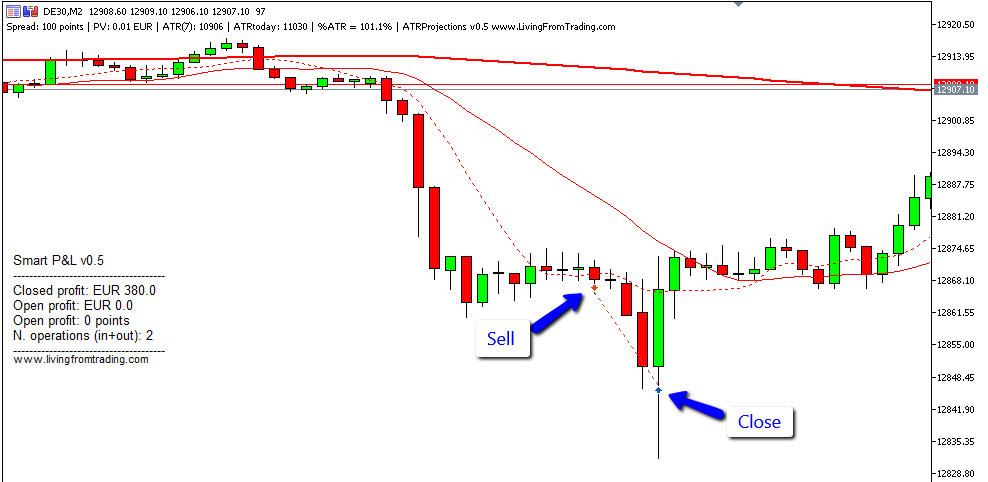
The price was on a downtrend, so I was looking just for shorts.
Waited for a pullback on the moving average and opened my sell trade.
In less than 8 minutes I entered and closed the trade with a nice 380€ profit.
I trade like this every single day!
What should you do now?
Indices like Dow Jones, Nasdaq, DAX, S&P500, and FTSE are great products to trade.
They often have consistent trends that allow traders to trade with confidence.
You can even trade them on very low time frames, like the 1-minute (M1) or the 2-minute (M2), my favorites!
If your broker doesn’t allow trading indices or has high spreads, check this one. That’s the broker that I use and consider one of the best brokers to trade with.
Indices have much less noise than forex and are more volatile, meaning that they can deliver great rewards for small risks.
You should definitely consider trading indices if you only know forex and are serious about trading.
Do you trade indices already?
How is your performance compared to forex?