
Often used as a strong reversal pattern, the Head and Shoulders is very popular amongst traders.
This classic reversal pattern is a high probability chart formation that predicts a bullish to bearish trend reversal with a big accuracy. The same formation can appear upside down, which we call as an inverse Head and Shoulders. In this last case, the pattern predicts a possible trend change from down to up.
Let’s look at them more closely.
How to identify the Head and Shoulders pattern on charts?
It’s very simple to identify this powerful reversal pattern.
Since it appears when the price is turning from a bullish move to a bearish move, we should look to spot the head and shoulders pattern after an uptrend of the price.
And what is an uptrend?
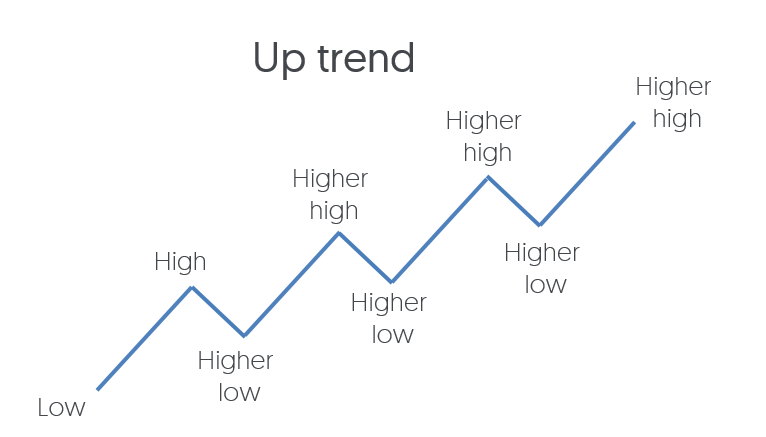
Simple, an uptrend is formed by consecutive higher highs and consecutive higher lows.
Every new high is above the previous high, and every new low is below the previous low. This is how it should look like:
And what happens after a head and shoulders appear?
Exactly, we should expect a downtrend!
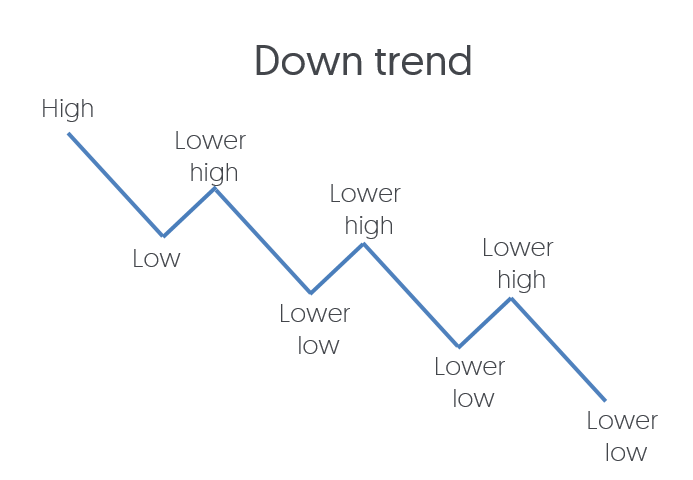
A downtrend is the opposite of an uptrend. In this case, we will expect the price to start making consecutive lower highs and consecutive lower lows.
It should look like this:
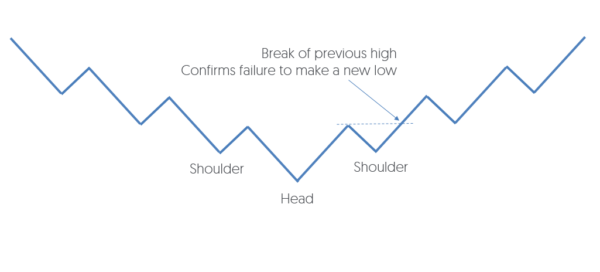
Now you are asking, what should you look for at the trend change point to identify the head and shoulders pattern?
It’s easier to understand if I put another picture here.
Let’s join that uptrend and downtrend pictures.
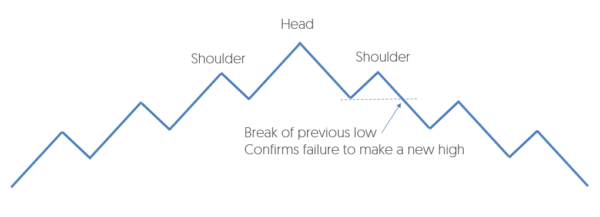
Look at the top of this picture.
That’s what we call the “head”, and that’s exactly the end of the uptrend. The last high of the uptrend sequence.
If you look carefully, after that high, the price failed to make a new high. And on the sequence, it broke the previous low and made another leg down.
The previous low is often called the “neckline”.
And when it’s broken, that’s our confirmation that the trend changed.
Now, look at the highs on both sides of the “head”. Do you see how those highs are at a lower price than the “head”?
That’s what we call the “shoulders”.
Now you understand where the “head and shoulders” name comes from.
Resuming, we need to identify an uptrend, then a movement sequence that forms three peaks. The middle peak should be higher than the left and right peaks.
This is a real example of the head and shoulders pattern:
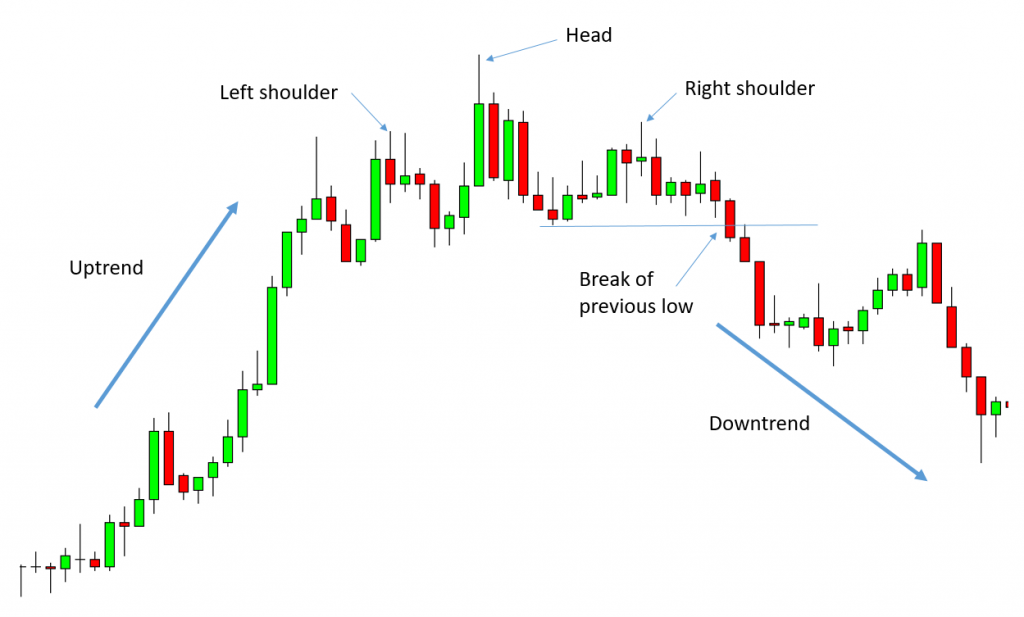
Again, the price was on an uptrend, making consecutive higher highs and higher lows.
At some point failed to make a new high.
After that failure, the price came down again and broke the previous low.
That’s our trend change confirmation, and that’s our head and shoulders pattern.
Easy to spot, right?
What is an inverted Head and Shoulders pattern?
The inverted head and shoulders pattern is a pattern that may appear at the turning point between a downtrend and an uptrend.
And how do we identify it?
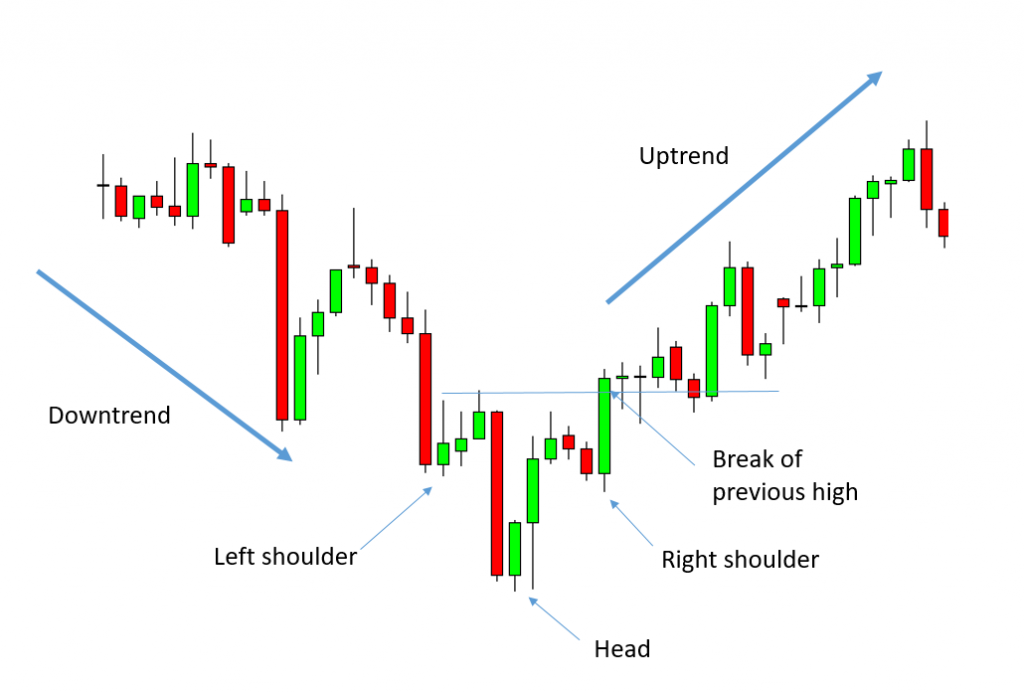
Well, that’s simple, let’s just turn the regular head and shoulders pattern upside down.
This time we had the price going down, making consecutive lower lows and consecutive lower highs. That’s the downtrend definition as we learned above.
At some point, the price makes the last low, which is not broken.
Instead, the price fails to make that new low and goes up, breaking the previous high.
And there we go, we have our head and shoulders pattern confirmed in the chart.
Let’s look at a real example:
Why does the Head and Shoulders appear?
Every move that a market does, is a battle between buyers and sellers. And whoever wins that battle, makes the price move on their direction.
When the buyers win a battle, the price goes up. When the sellers win the battle, the price moves down.
Every time that we have a new high, the price starts to come down, and then it immediately changes to the upside again, breaking the previous high, the buyers won another battle.
Every push up on the price will keep it going on an uptrend.
And everything changes when we have the last peak.
Well, we don’t know yet that this is the last peak yet.
We need to wait for the price to continue to tell us the history.
After what it will be the last peak, the bulls try to make another push to the upside. But at this point, there are more sellers in the market than buyers.
The buyers don’t have enough strength to keep the price going up and that new high fails.

That’s the end of the bullish momentum.
The buyers are defeated, and now it’s time for the sellers to start their path down, which is confirmed when the previous low is broken.
The reversal head and shoulders pattern is completed.
When we are on a downtrend, everything appears exactly in the opposite way.
The sellers are driving the price down, they win every battle and the momentum is bearish.
At some point, they don’t have enough strength to keep making the price go down. They try one last push, after the last low, but they can’t make it.
The buyers are appearing and showing their strength.
As the price fails to make a new low and starts going up breaking the previous high, we have the inverted head and shoulders reversal pattern completed.
How to trade the Head and Shoulders pattern?
There are several ways that you can take advantage of the head and shoulders pattern to trade.
Since it’s a trend reversal pattern, the best strategies would be strategies that follow trends.
Don’t bee greedy

The head and shoulders pattern is a reversal pattern as you already know.
But keep in mind that a reversal may be short-lived, especially if the daily trend is very strong.
Strong trends don’t stop easily. Sometimes the price just needs to take some bigger rests during its way up.
Imagine that you are climbing a big mountain with your bicycle. From time to time you may need to stop a little bit to rest, and then keep going your way up.
But after some hours going up, you may need to take a bigger rest, stop, drink, eat something, and only then you continue.
That’s the same with the strong daily trends.
You have some small stops, during the way up, but then you may have some bigger ones.
Those bigger ones may have just a couple of legs down before the price goes back up again and returns to the original daily trend.
Grab the opportunity to make some profits, but keep looking for a possible new trend change again.
The most important thing, whatever you do, make sure that you trade consistently every day.
The best time frame to spot it
The market moves happen the same way accross all time frames.
If you see a chart of a 2-minute time frame, or a 1-hour time frame or a daily time frame, you will see that the geometry of the movements is the same.
That’s why it is called a fractal. Something that occurs the same way, regardless of the zoom level (time frame) that we use to see the market.
For this reason, you can use any time frame to trade and to spot this Head and Shoulders reversal pattern. Just choose your best time frame to trade and you’ll be fine.
Conclusion
The Head and Shoulders pattern is a very simple way to detect a possible change from an uptrend to a downtrend.
The same applies to the Inverted Head and Shoulders pattern, it points a possible change from a downtrend to an uptrend.
As traders, we can take advantage of this trend change, quickly adapt to it, changing our trade direction, and consequently increase our accuracy.
What about you? Do you already use this pattern to filter your trades directions?