
RSI divergences are a popular day trading chart pattern.
This guide will walk you through all you need to know to trade RSI divergences.
We’ll cover:
- What is a divergence?
- Bullish RSI divergence
- Bearish RSI divergence
- What does an RSI divergence tell us?
- How to trade with divergences?
- How to find bullish RSI divergences step by step
- How to find RSI bearish divergences step by step
- Recap
Let’s start from the beginning.
What is a divergence?
An RSI divergence is a chart pattern where the RSI indicator is not synced with the price action.
What does not sync mean?
It means that the price is going in one direction, while the RSI indicator is going in the other direction.
That’s why we call it divergence.
It’s very simple to spot.
Let’s see some examples of divergences.
We can divide them into bullish and bearish divergence chart patterns.
Bullish RSI divergence
Here we want to see the price making lower lows.
And at the same time, we want to see the RSI indicator making higher lows.
Here’s an example of a bullish divergence on your charts.
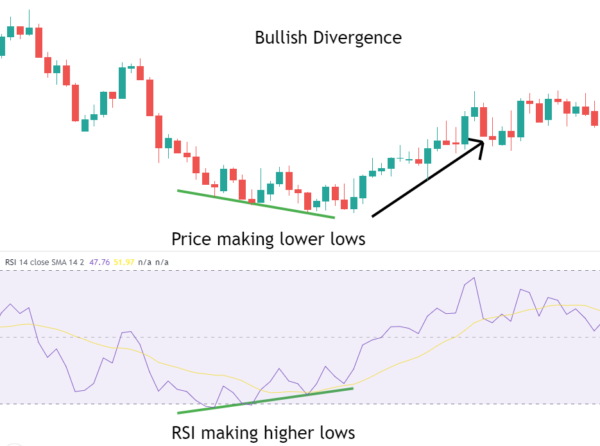
The price was heading down, making lower lows.
Initially, the RSI indicator was following the price, making lower lows too.
At some point, the RSI starts making higher lows while the price is still heading down.
That’s when your divergence pattern appears.
After a bullish divergence, the price will tend to change from a downtrend to an uptrend.
Now let’s look at the next scenario, a bearish divergence.
Bearish RSI divergence
This one is the opposite of the bullish divergence pattern.
We want to see the price making higher highs.
And at the same time, we want to see the RSI indicator making lower highs.
It’s very simple to spot.
Here’s what a bearish divergence pattern looks like on your charts:
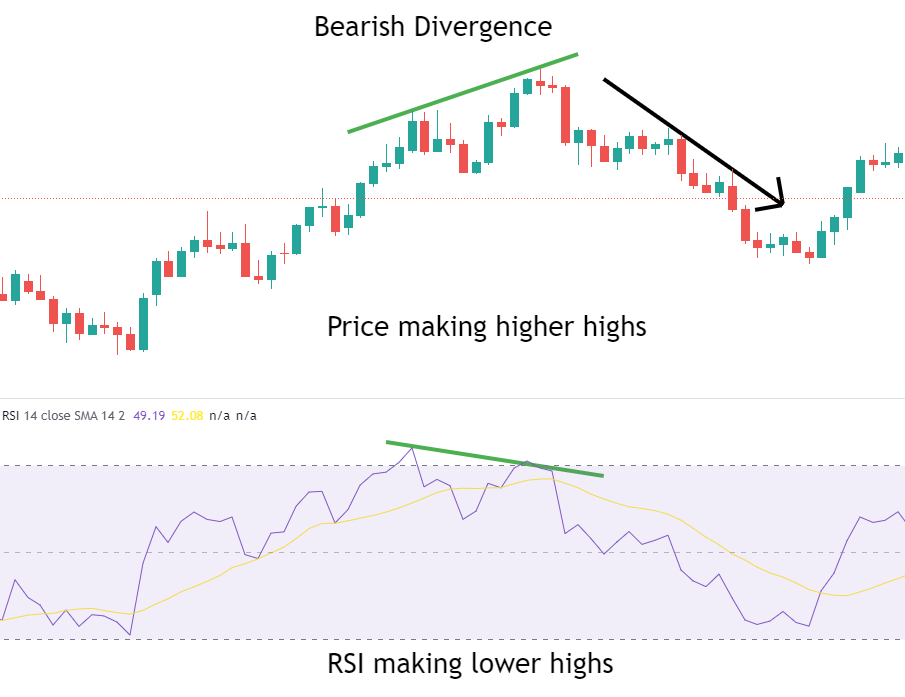
Notice that at first, the RSI indicator was moving with the price.
As the price made higher highs, the RSI also made higher highs.
No divergence here yet.
At some point, the price kept making higher highs, but the RSI didn’t follow.
It started to make lower highs.
That’s when our bearish divergence appeared.
And that’s also when the price switched from an uptrend to a downtrend.
What does an RSI divergence tell us?
The RSI divergence is a powerful trend change signal.
When we spot a bearish divergence, we should expect a change in the trend from bullish to bearish.
On the other hand, when a bullish divergence appears on our charts, we should be careful because a trend change to the upside may be imminent.
How to trade with divergences?
RSI divergences can be used to open trades, as well as to close trades.
When used to open trades, we are expecting to trade a trend that may be about to start.
If we use divergences to close trades, we use the signal to get out of the market when an RSI divergence signal against our trade direction appears.
Makes sense?
Now, let’s see step by step how to spot these RSI divergences step by step and then went to open our trades.
How to find bullish RSI divergences step by step
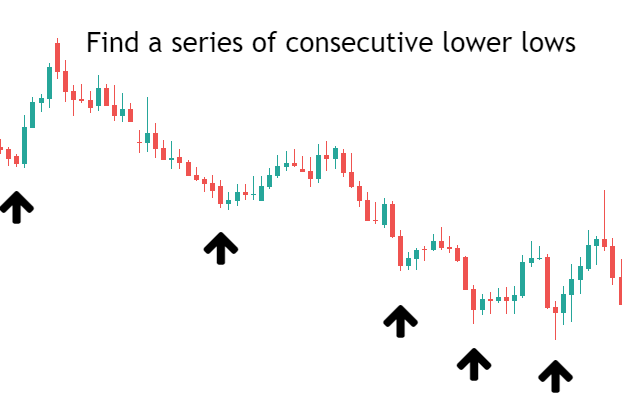
Step 1 – Find a downtrend or a series of consecutive lower lows
First, we want to detect a market that is going down.
For a bullish divergence, we will be watching a market that is on a downtrend.
We don’t necessarily want a downtrend that is going on for a long time since a divergence can be found inside markets that are ranging sideways.
Any series of consecutive lower lows, even if inside a range, is fine.
Here’s an example of a downtrend:
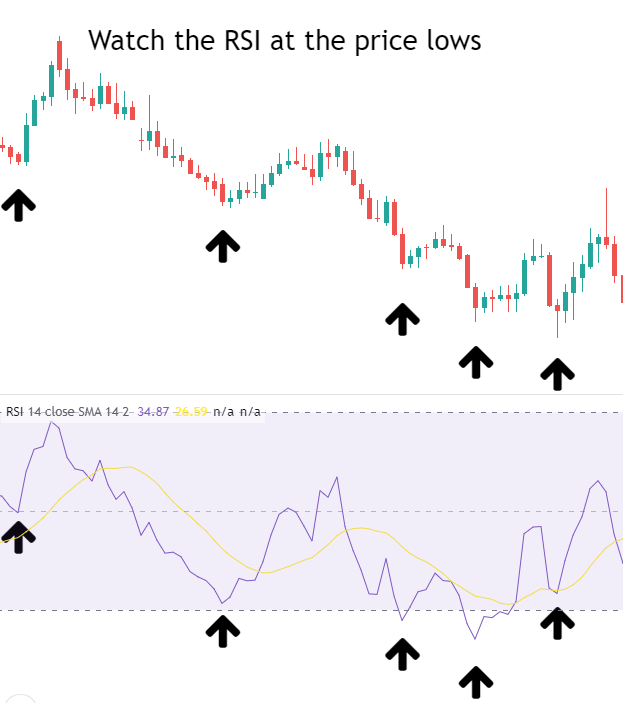
Step 2 – Watch the RSI at the price lows
Now that we spotted the price lows, we want to see what the RSI indicator is showing us at those lows.
This is what we got in our example:
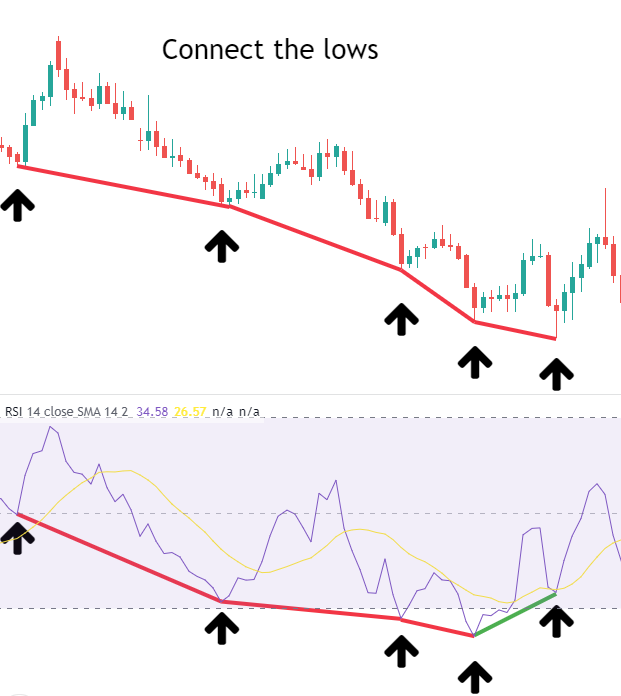
Step 3 – Connect the lows and find a divergence
This step is simple, we just need to draw lines.
Each line, or trendline, should connect two consecutive lows.
And we do this both on the price lows and on the RSI lows.
You can use two colors to make it simpler.
Red if the line is pointing down, and green if the line is pointing up.
This is our example:
Step 4 – Find the divergence = different color lines
The lines have color just to be easier to find the divergence.
Basically, we just want to find colors that don’t match.
That would be, a red line on the price, consecutive lower lows.
And a green line on the RSI indicator, consecutive higher lows.
Here’s what we found and what happened next:
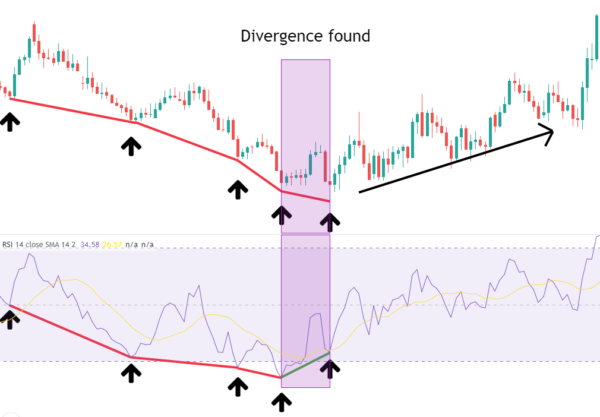
As you can see the price started moving up after the bullish divergence was found.
When the bullish divergence is spotted you can do two things:
- Close your short position if you have any open.
- Go long on the market (more details on this in a while)
Let’s first look at the bearish divergence scenario.
How to find RSI bearish divergences step by step
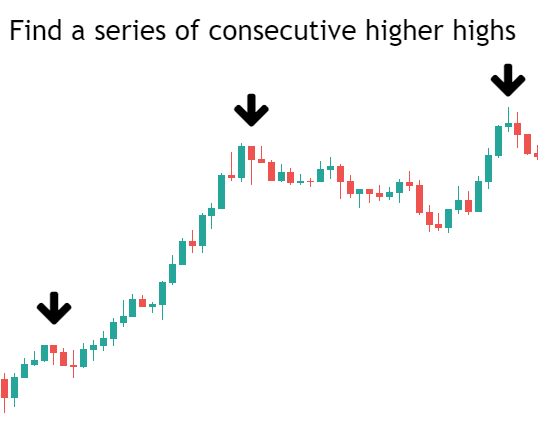
Step 1 – Find an uptrend or a series of consecutive higher highs
Here we want to watch for an uptrend because we are looking for a change to a bearish move.
A series of consecutive higher highs is what we need to find a divergence.
We don’t need to find a long-term uptrend with dozens of higher highs.
Just a couple is enough.
I just found some here:
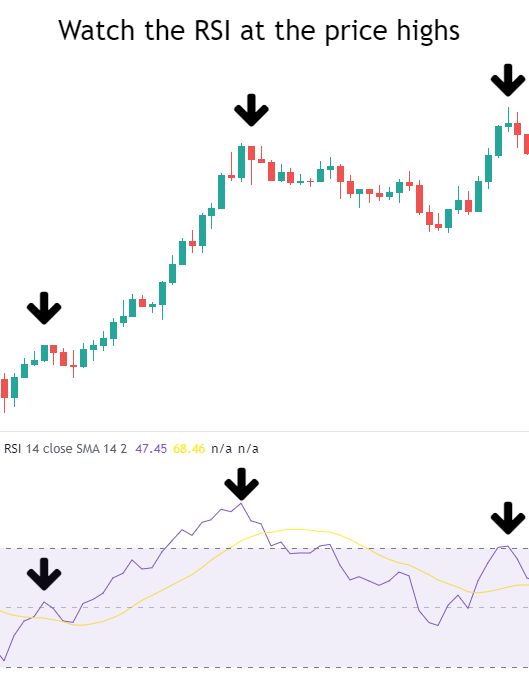
Step 2 – Watch the RSI at the price highs
Now, we want to check what the RSI indicator is doing in these highs.
So we go on and mark the peaks of the RSI that match the highs that we found on the price.
Here they are:
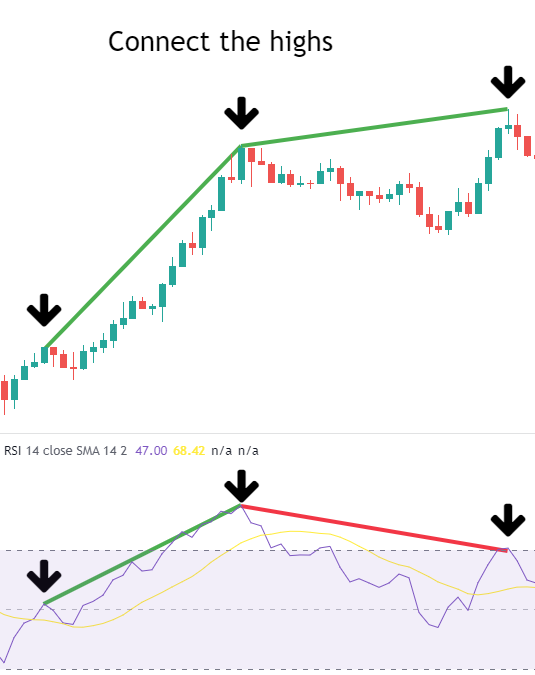
Step 3 – Connect the highs
Next, we connect the highs that we just found.
First, we connect the highs of the price and then we connect the same highs on the RSI indicator.
We can use different colors to visualize better if the highs we higher or lower.
Here I used green for higher highs and red for lower highs.
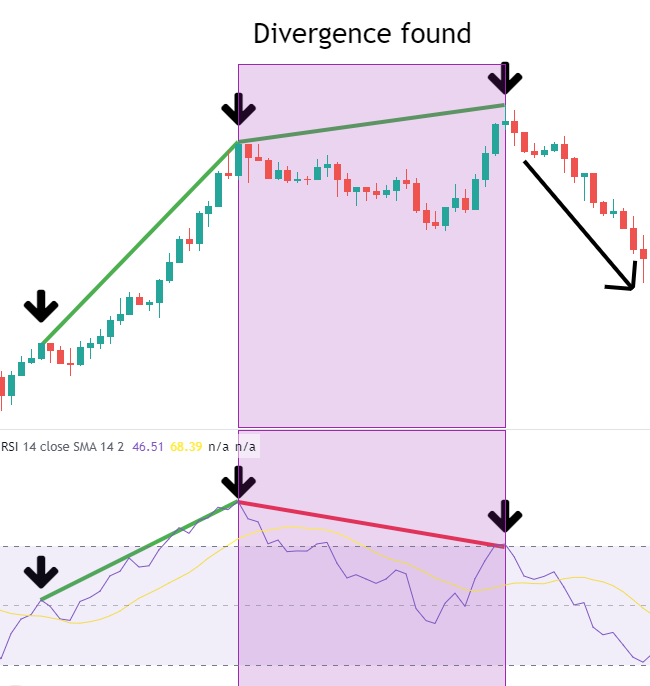
Step 4 – Find the divergence = different color lines
Finally, we check if there are any sections with different line colors.
That will be our divergence.
And I just found a divergence, with a green line in the price and a red line in the RSI indicator.
Look what happened next, the price made a bear move right after the divergence.
Triggers to trade RSI divergences
Method #1 – The pullback after the divergence
For this method, we want to wait for a pullback after the second point of the divergence is found.
In case you’re wondering, a pullback is just a small move against a trend before the price returns to the trend again.
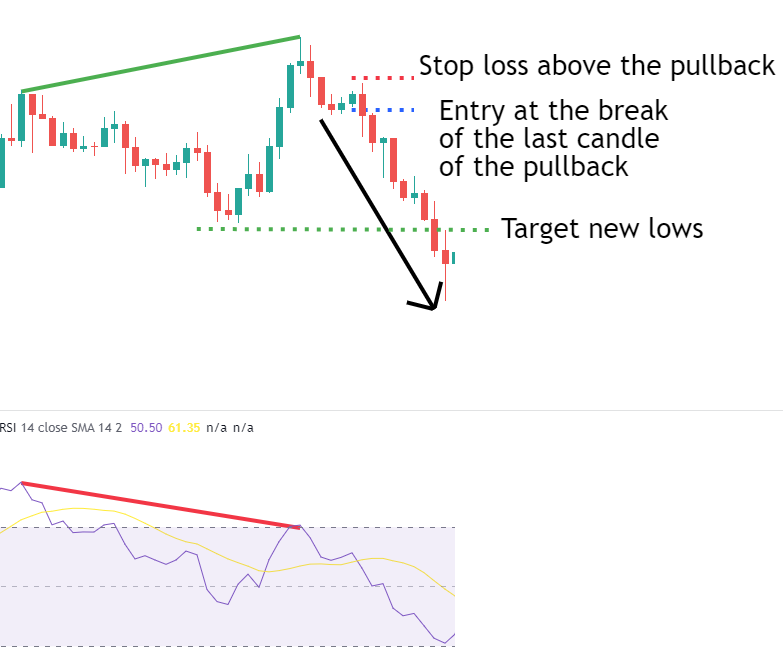
Let’s look at a bearish divergence scenario.
The key here is to wait for a failed pullback to the upside.
As the price fails to continue the initial trend, a reverse is more likely to happen.
That’s our trigger to short the divergence chart pattern.
The pullback that fails a move to the upside, is actually a pullback for the next leg to the downside.
Our entry can be any kind of rejection pattern like a pinbar, or an engulfing pattern.
To close our trade we wait for a decent risk/return ratio when the price makes new lows, or we wait for a divergence to appear in the opposite scenario.
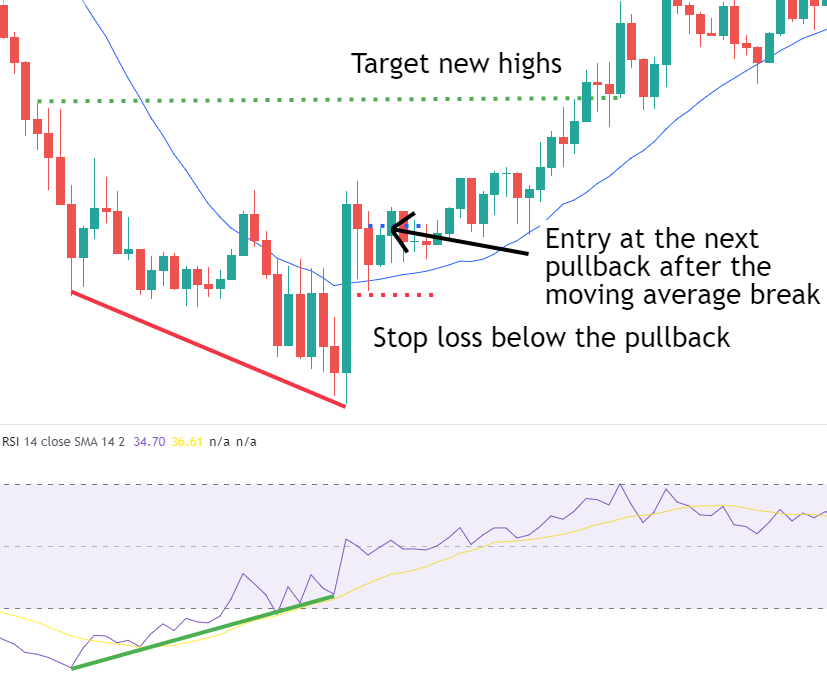
Method #2 – The pullback after the moving average break
This method uses moving averages and it’s the best to use after long trends.
Basically, we are waiting for a pullback after the divergence appeared.
But we don’t go immediately on any pullback.
We first wait for the price to cross the moving average to the upside first.
Then we wait for a pullback to the moving average.
And that’s our trigger to trade our divergence chart pattern.
As an alternative, trading using fibonacci to get the entry point is also a good option.
To close our trade we wait for a decent risk/return ratio when the price makes new highs, or we wait for a divergence to appear in the opposite direction.
And that’s it.
Let’s recap what you learned today
- An RSI divergence is a chart pattern that is formed when the price trend is not synced with the RSI indicator trend.
- For a bullish divergence, we want to see the price making lower lows, while the RSI indicator is making higher lows.
- For a bearish divergence, we are watching the price making higher highs while the RSI indicator is making lower highs.
- When we find a divergence we should expect a change in the price trend, even if just temporary.
- We can use divergences to open trades, close trades, or both.
And now I want to hear from you.
How do you trade divergences?
Do you use any other indicator to increase the accuracy?
Let me know below in the comments.

this is the best and most intellectual explanation of divergence to newbie traders… I recommend this to anyone.
Thanks for this
Great to know it helped, Max.
Thks for share. One question. What is the Moving Average you use?
In these examples I used an SMA with 14 periods.
I never thought about color-coding the trendlines until I read this article. Very nicely written!
The colors help to visualize better.
Thank you for your feedback!
Very intelligent simple indicator and excellent explanation. It’s very accurate that shows what will happend before it does.
I also use EMA Ribbon 1, 10, 20, 50.
I found an Indicator on TradingView RSI Divergence [Shizaru Sep 27, 2016] that shows automatically the green and red line.
My biggest problem. In what tyme frame to buy ?
I am not a scalper, but I wish to find the bottom for longs and the top for shorts.
Glad that you liked the article.
You can use any time frame, depending on your trading style.
I suggest that you backtest your strategy first on different time frames, and then choose the one that woud give you the best results.
Thank you for this wonderful teaching…… More wins!!
Thank you, Agada. Let’s make some money!
What we can add with rsi divergance for confirmation
A lot of things can be added, or you don’t need to add anything at all.
Just try different indicators, backtest them, and see if you get better results or not.