
You really don’t want to get caught trading on the wrong side of the trend.
Trust me, I’ve already been there.
That’s why I created this huge guide to keep you safe from trouble.
It’s valid for day trading, scalping, or longer-term trading.
Here’s what you’re going to learn:
- What are Bull and Bear markets
- How are the tops of the markets formed?
- Why should you trade markets that are trending?
- How to trade with trendlines?
- How to trade with channels?
- How to trade with moving averages?
- How to trade with Fibonacci?
- Oversold vs Overbought
- Bullish and Bearish Indicators
- Detecting trend changes
- Bull and Bear traps
- Where should you invest during a bull market?
- Where should you invest during a recession?
What is a Bull market?
A bull market is a market that goes up.
Follows an uptrend.
As time passes, the price tends to increase.
But of course that this movement doesn’t happen following a straight line.
The price always oscillates to the upside and to the downside.
Here’s how it looks:
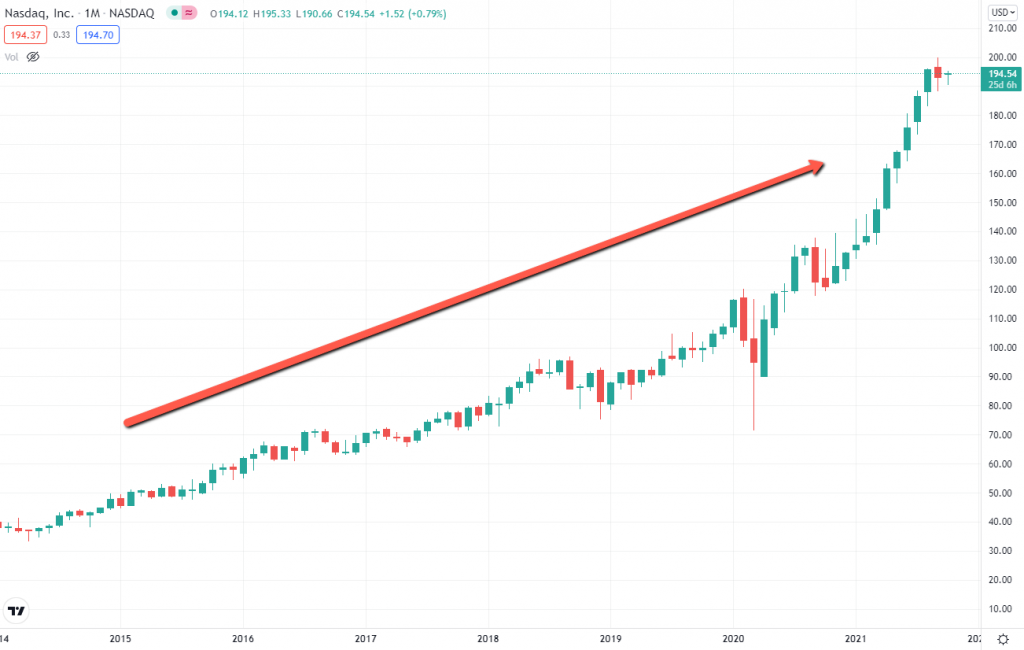
The main aspect is that on each oscillation the movement to the upside tends to be bigger than the movement to the downside.
That makes the price increase over time, creating a bull market.
A market that follows an uptrend.
What is a Bear market?
A bear market is exactly the opposite of a bull market.
Instead of going up, the price will tend to decrease.
Each oscillation to the up and downside will throw the price to lower values.
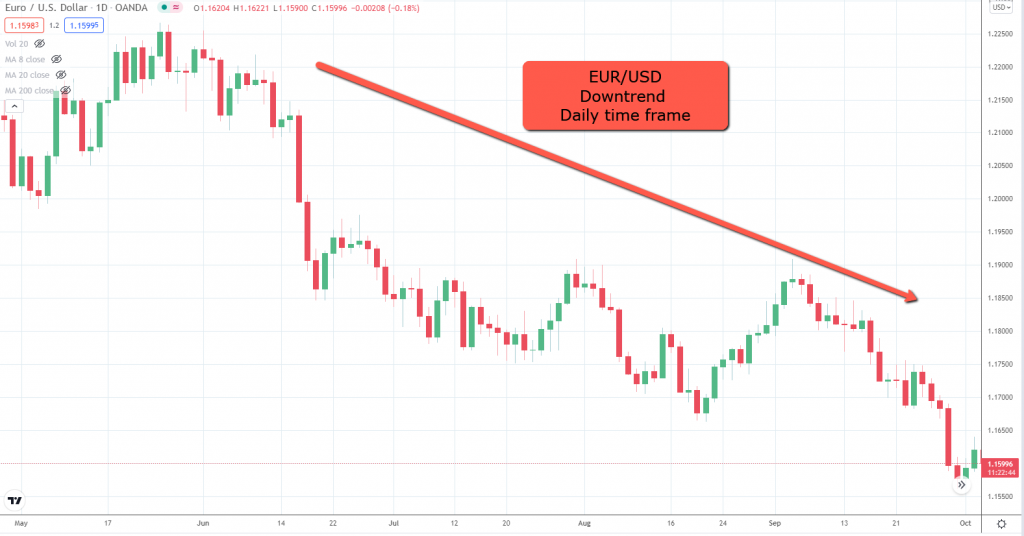
Here’s what it looks like:
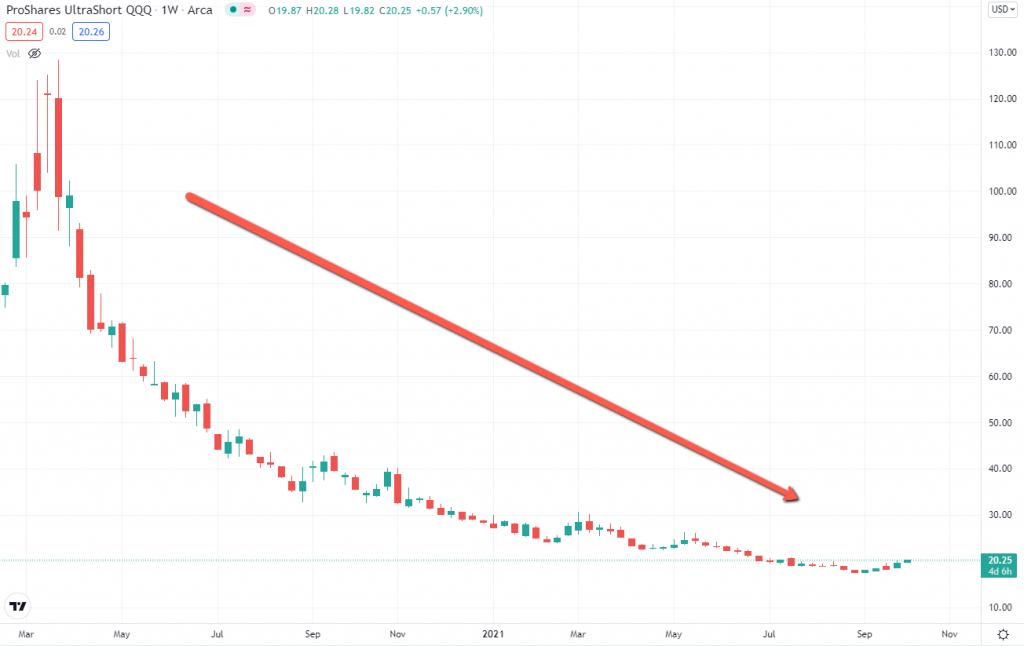
The downside moves are bigger than the upside moves.
And while these movements keep repeating, the market is on what it’s called a downtrend.
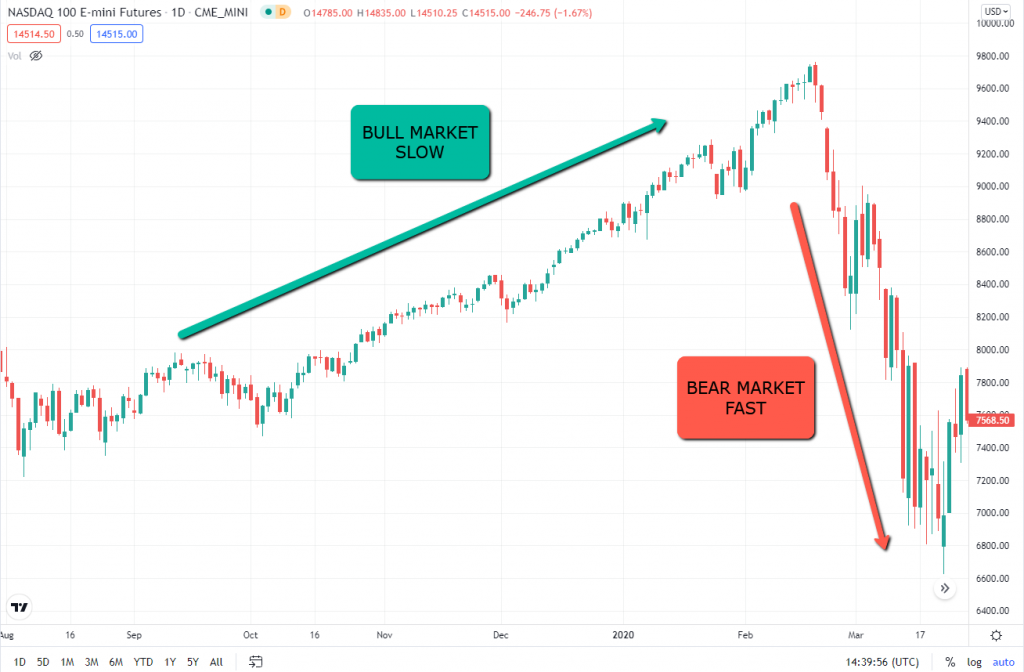
How are the tops of the markets formed?
A bull market tends to move slowly.
Traders start to build their positions slowly as the market goes up.
But then, at some point…
People start selling to get profits from their investments.
And there are two main reasons for that:
- They already have a good amount of profit and want to get returns from their investments.
- The fundamentals change due to economic reasons, traders start to be skeptical about the continuation of an uptrend and start selling their positions
This makes the market start to go down.
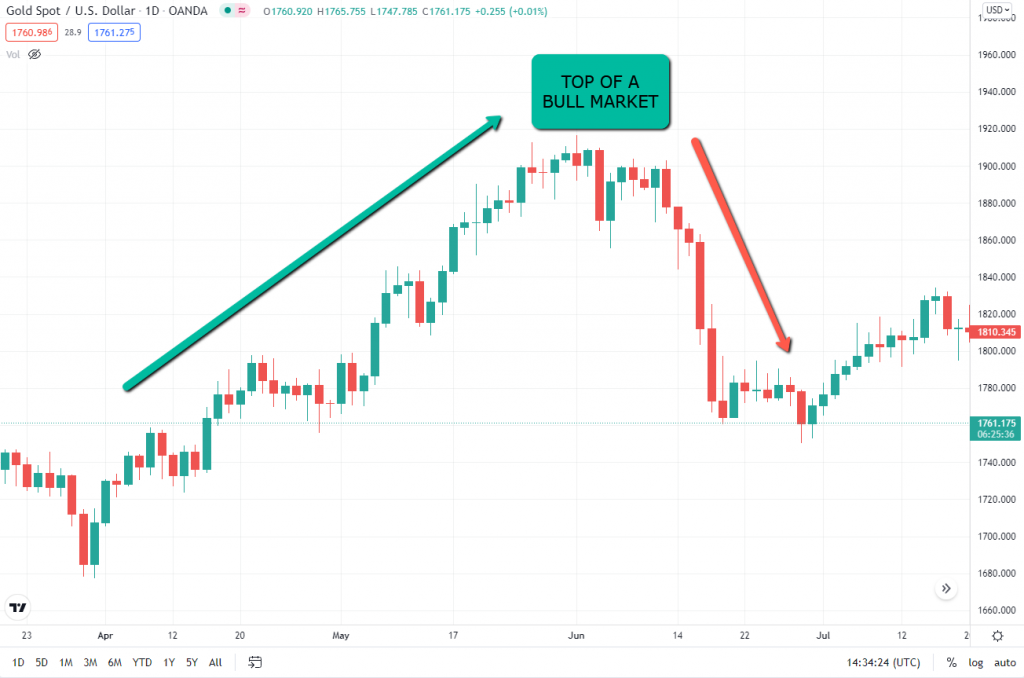
And as this happens, all the other traders start to feel fear, especially the ones that started buying late, before this first big dip in the market.
They see their positions going into red territory, and they start selling too.
As more traders feel the selling pressure and start selling too, the market starts to dive faster and faster.
It leads to a roller-coast, that frequently creates a market crash.
Do you know where the Bull and Bear names come from?
In California, 19th century, fights of bulls and bears were used to entertain the population. Bulls tend to fight, charging with their horns to the upside (bull market). Bears tend to fight using their paws to strike from top to bottom (bear market).
Bear markets tend to have aggressive moves to the downside and in a few weeks can erase all the hard work that a bull market could achieve through a lot of years.
And you know what…
During the real bulls and bears fights, bears would win most of the time.
With strong attacks.
The financial markets are always a battle between bulls and bears.
When the bear traders attack, be careful, the bull side may not be safe anymore.
Why should you trade markets that are trending?
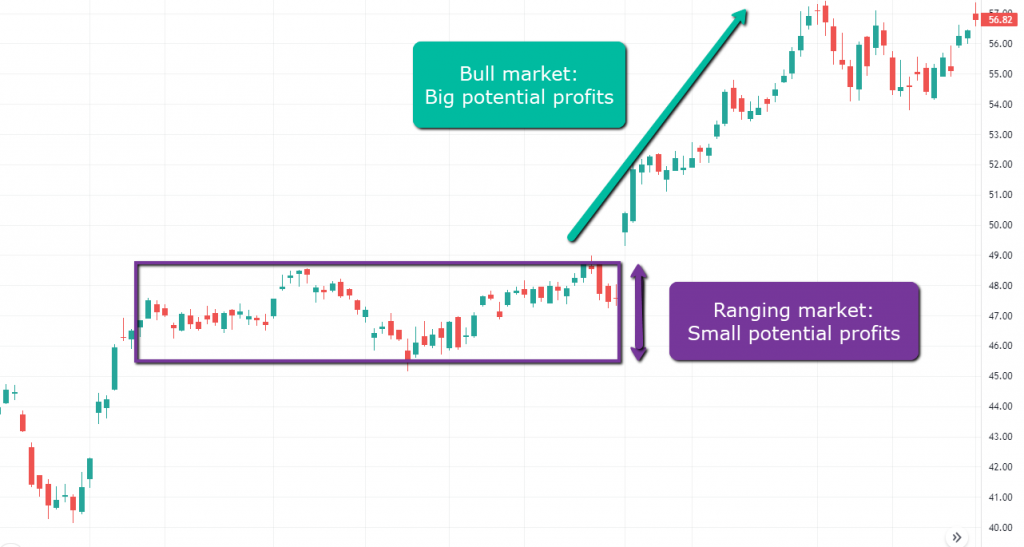
Trending markets are the ones that potentially can deliver the biggest profits.
Why?
Because they are moving, either up or down.
Not ranging.
And while the trend keeps going you can let your positions run for a long time.
This is very different than markets that are moving sideways.
Since they move within a range, there’s usually not much space to move before you take your profits.
Look at how it looks:
But how do you trade trending markets exactly?
The most popular ways are using:
- Trendlines
- Channels
- Trend indicators (Moving Averages, Bollinger Bands, Ichimoku, and others)
- Fibonacci retracements
Let’s go through them.
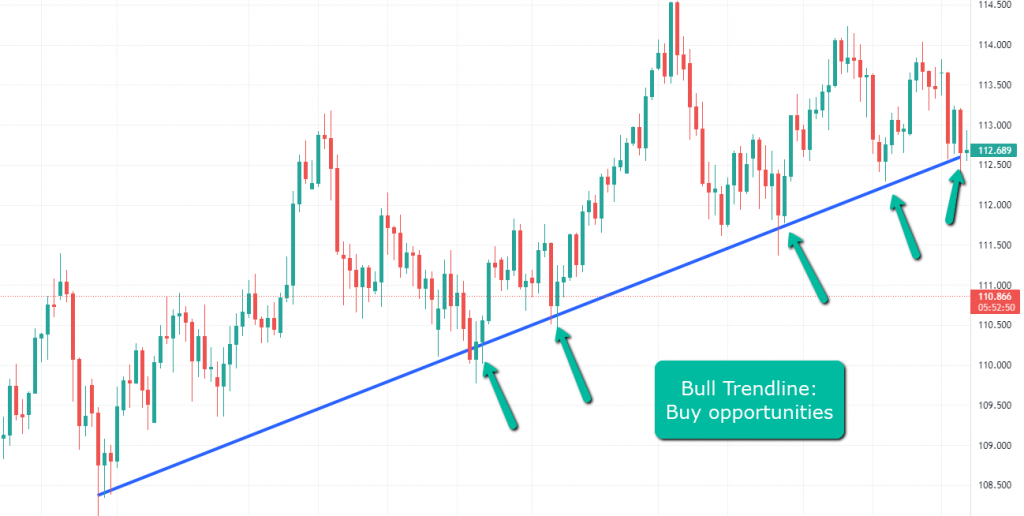
How to trade a bull market with trendlines?
First, you need to draw a trendline.
You do this by finding two consecutive lows on an uptrend.
Just draw a line passing through those lows and extend it to the right.
Any touch and rejection from that trendline is a potential buy opportunity.
This is what it looks like on a chart:
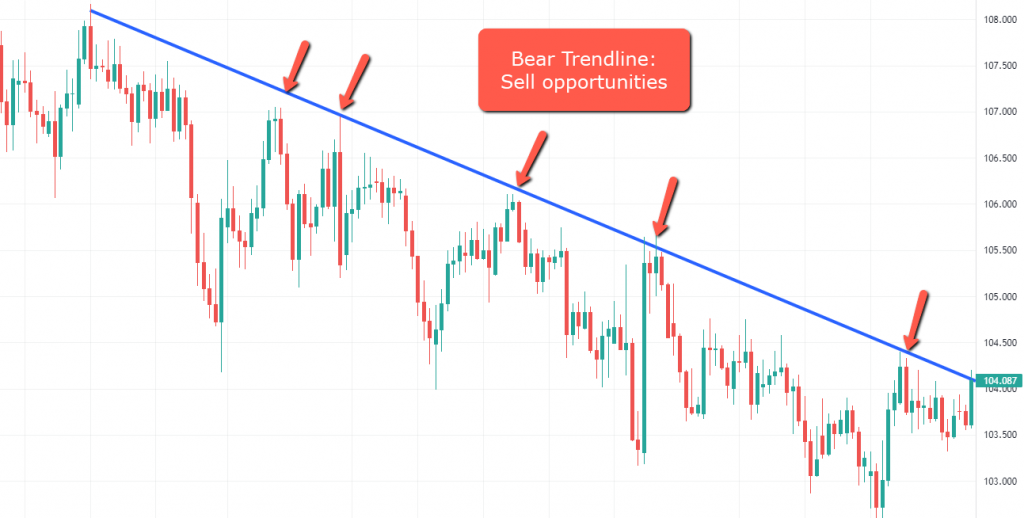
How to trade a bear market with trendlines?
In a downtrend, you also use two points to draw a trendline.
But now, you’ll use two consecutive highs.
And then you extend the line to the right.
Any touch and rejection from that line is a possible short opportunity.
Here’s a chart example:
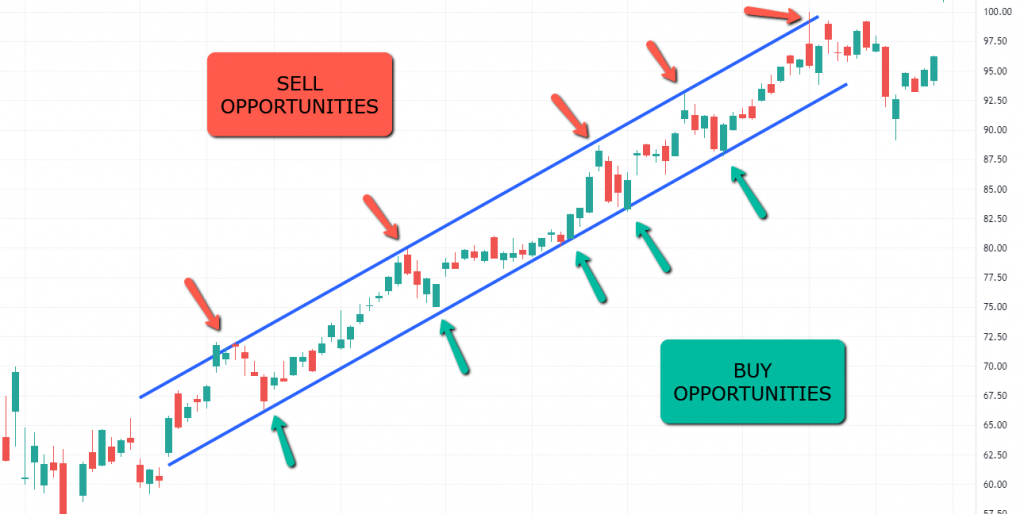
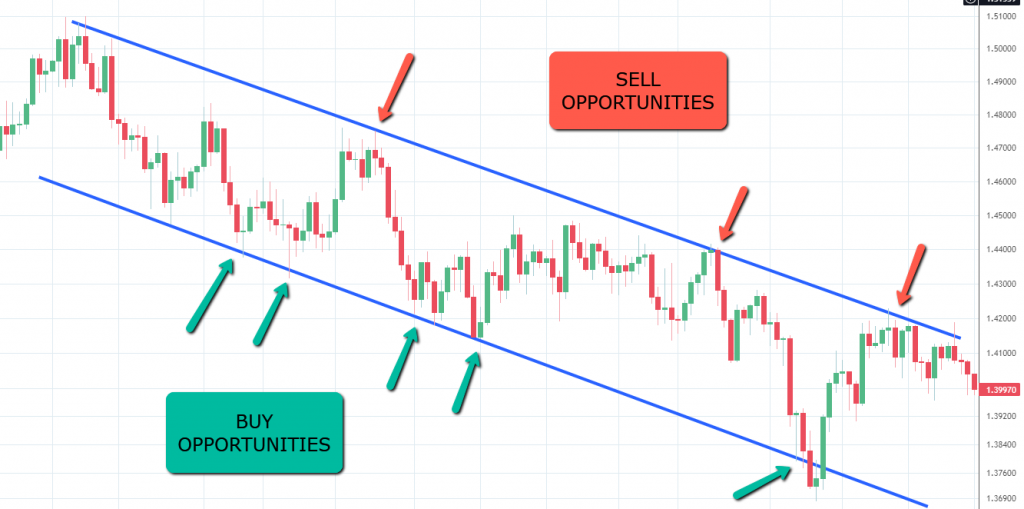
How to trade a bull market with a channel?
A channel is nothing more than two parallel trendlines.
In a bull market, you start by drawing a trendline using the first two consecutive lows.
The same way as we saw above.
Then you just need to project that trendline to the upside of the candles.
If the highs of the price movement match the upper trendline, then you have your channel.
How to trade it?
Simple, just buy when you see rejection from the bottom of the channel.
When the price reaches the top of the channel you can close your trade and eventually also short the market aiming for the low of the channel.
Here’s an example:
How to trade a bear market with a channel?
You start by drawing a bearish trendline as we learned previously.
Remember, you need to use two consecutive highs.
Then you create a parallel trendline to match the previous lows.
If the market is respecting those lows, then you have your channel.
Any touch at the top of the channel is a possible short opportunity.
Any touch at the lower trendline of the channel is a possible long opportunity.
Here’s a chart example:
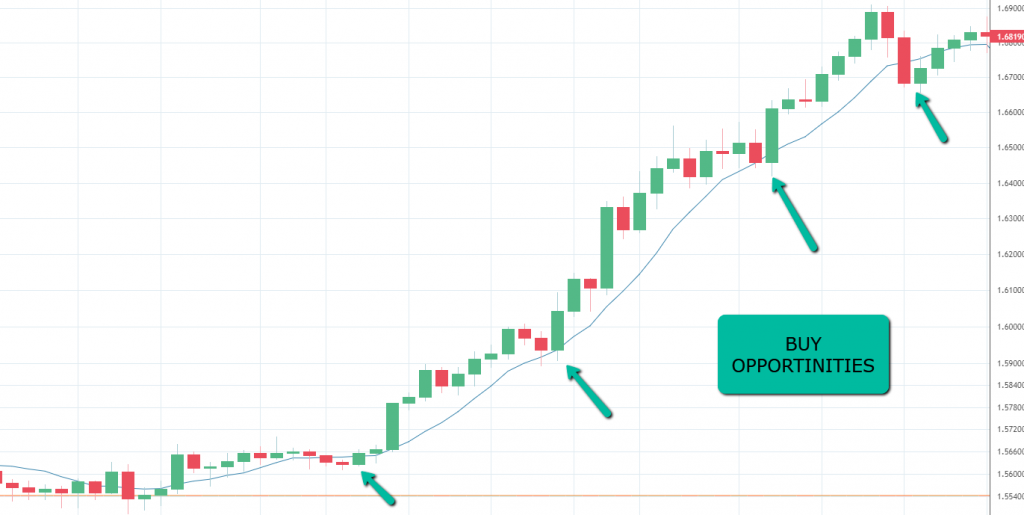
How to trade a bull market with moving averages?
Moving averages are one of my favorite ways of trading.
You can use moving averages with different periods.
The most popular are the 8, 20, 50, and 200.
You want your moving average to be below the price.
Once you find the one that adapts better to the market trend, you’re good to go.
Just wait for touch and rejection from the moving average and there you go.
You have your buy opportunity!
Here’s what it looks like:
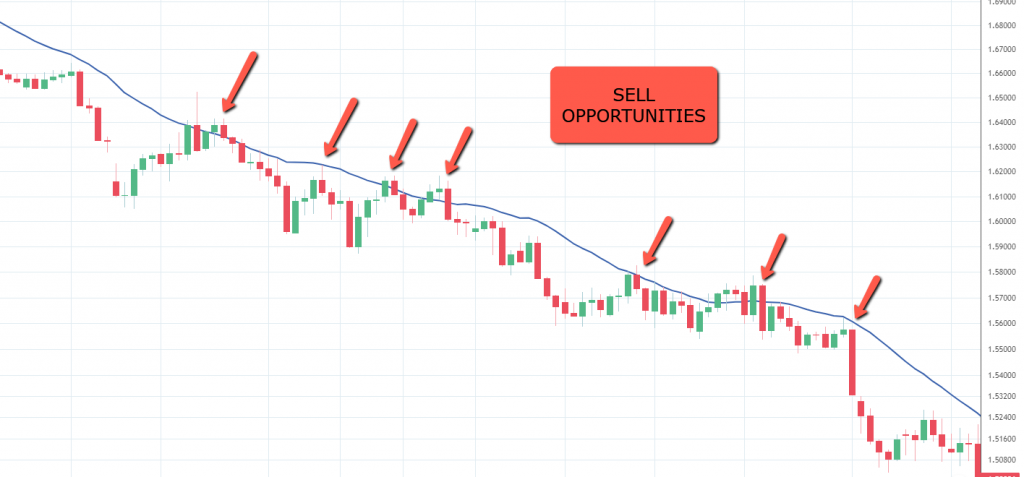
How to trade a bear market with moving averages?
During a bear market, you can use the same moving averages.
The most popular periods are 8, 20, 50, and 200.
Just put them on your charts and choose the one that adapts better to your market trend.
Now we want the moving average to be above the price.
Then you just need to wait…
A touch and rejection from the moving average is your possible short opportunity.
Look at an example:
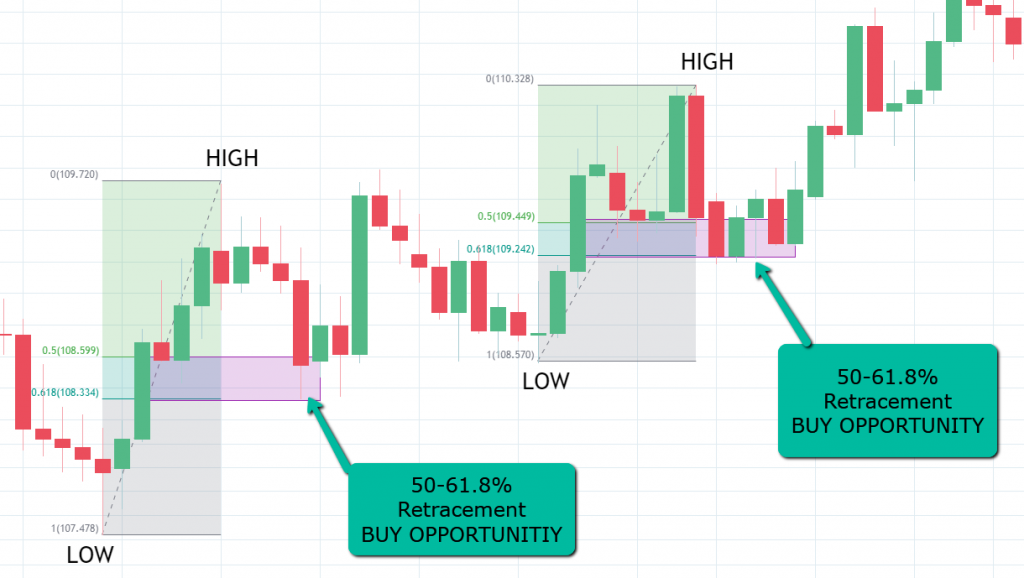
How to trade a bull market with Fibonacci?
Fibonacci is a great way of trading.
On an uptrend, you want to look for highs and lows
Once you spot them pick the Fibo tool from your platform.
Draw it from the low to the high.
Then you wait…
You want to see the price coming to the zone between the 50-61.8% levels.
That’s where the price tends to be rejected more often.
And that’s where you want to take your long trade.
A couple of chart examples:
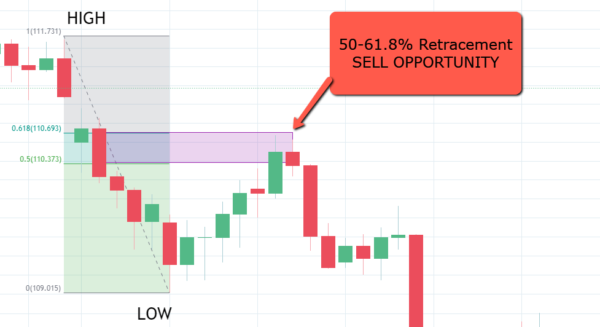
How to trade a bear market with Fibonacci?
Trading a bear market with Fibonacci also requires you to find the highs and lows.
But now you draw it differently.
Instead of peaking the low first…
You pick the high and drag your Fibo to the next low.
Now you wait again.
You want to see the price retracing to the 50-61.8% level.
When you see a rejection there, that’s your short opportunity.
This is an example:
Oversold vs overbought
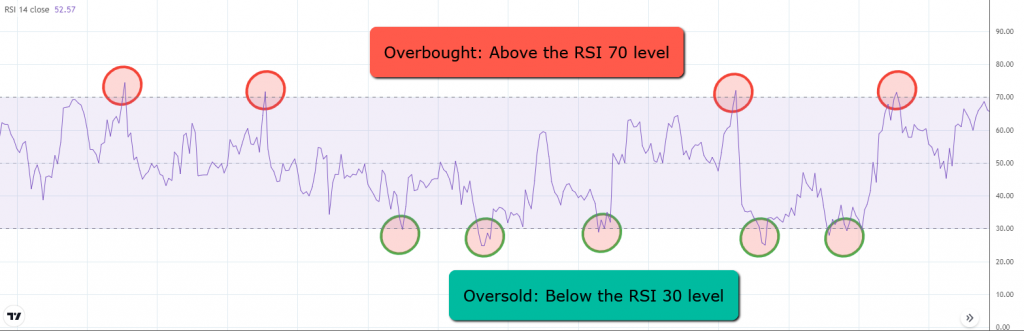
Oversold and overbought are concepts that can be used to trade using the RSI (Relative Strength Index) indicator.
RSI is a momentum oscillator that moves between 0 and 100.
When its values are above the RSI 70 level, it means that the price is overbought.
When it’s below the RSI 30 level, it’s considered that the price is oversold.
It looks like this:
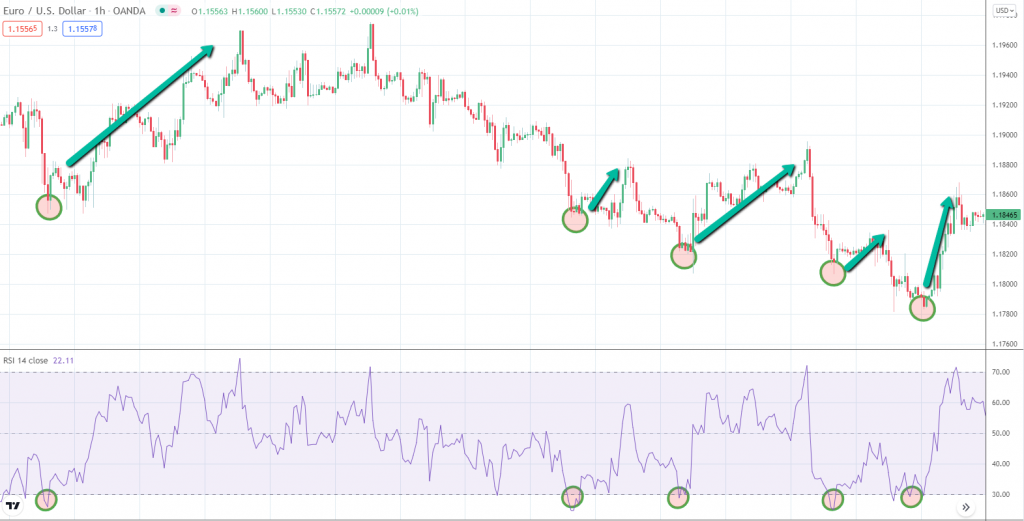
Is oversold bearish or bullish?
A market that is oversold, is a market that is already bearish for a long time.
At this point, the RSI values should be crossing the RSI 30 level.
For this reason, there’s a high chance to start a move to the upside.
That said, oversold is a sign of a possible bullish trend starting.
This is what typically happens when the price goes to oversold RSI levels:
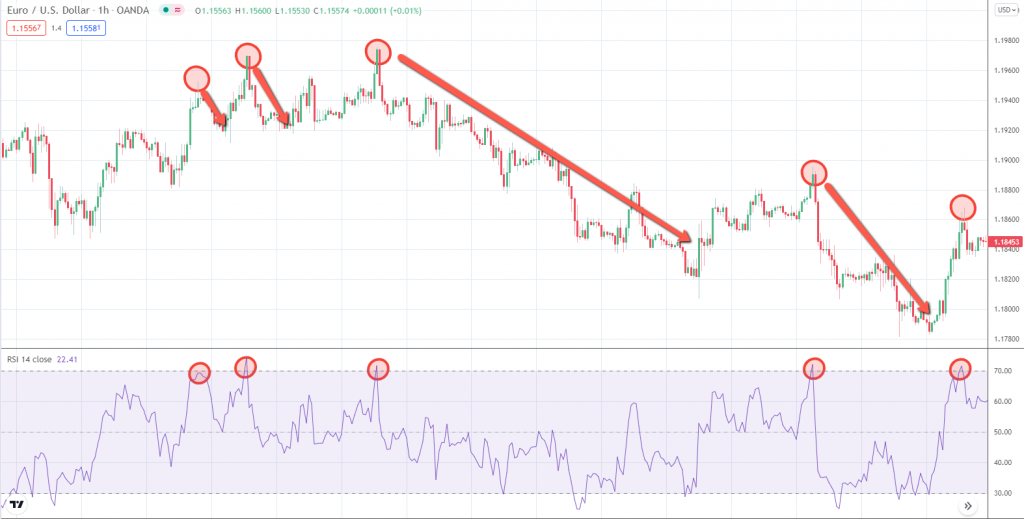
Is overbought bearish or bullish?
Overbought is the opposite of an oversold market.
When the market is overbought, it means that it’s already going up for a long time.
When this happens, the RSI goes above the 70 level.
That’s the threshold to consider the market as overbought.
A bearish sign from the price action is a good indication to go short.
That said, overbought is a sign of a possible bearish trend starting.
This is what typically happens in overbought levels:
Can you be bullish and bearish at the same time?
Absolutely!
Are you confused?
Let me explain to you.
Trading bullish and bearish moves on the same market
The markets can be traded in different time frames.
Each time frame can show a different trend, either bullish or bearish.
Higher time frames tend to be stronger.
Look at this chart in a daily time frame.
The market is bearish, going down.
What’s the best direction to trade?
Exactly.
Shorting the market!
On the other hand…
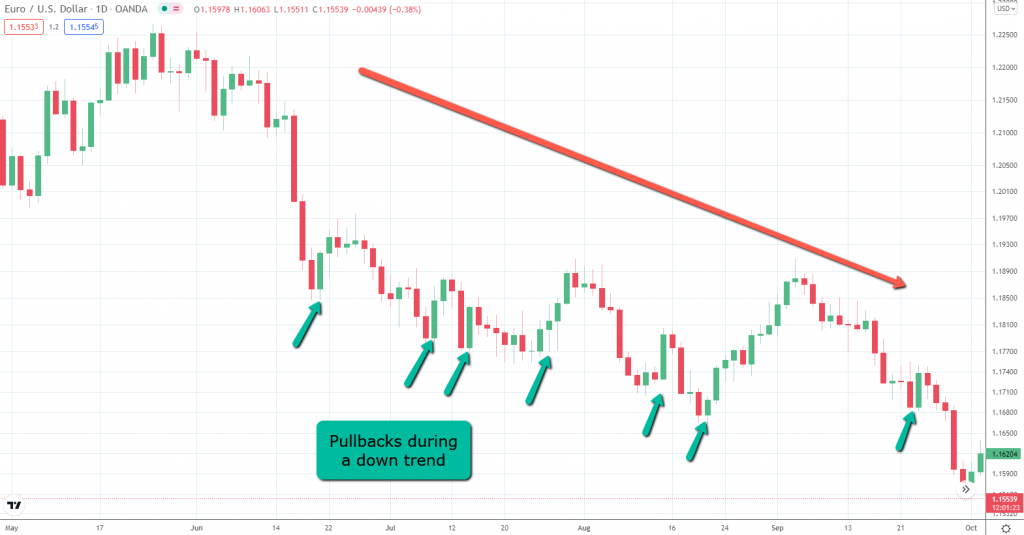
The price tends to make pullbacks when it’s trending.
A pullback is just the market breathing.
And then it goes back to the original trend.
In a higher timeframe, this can last only a couple of candles.
Like this:
In a lower timeframe, it will create a temporary uptrend.
We saw the market on a downtrend in a Daily time frame.
Now, look at M15 on a pullback from the Daily:
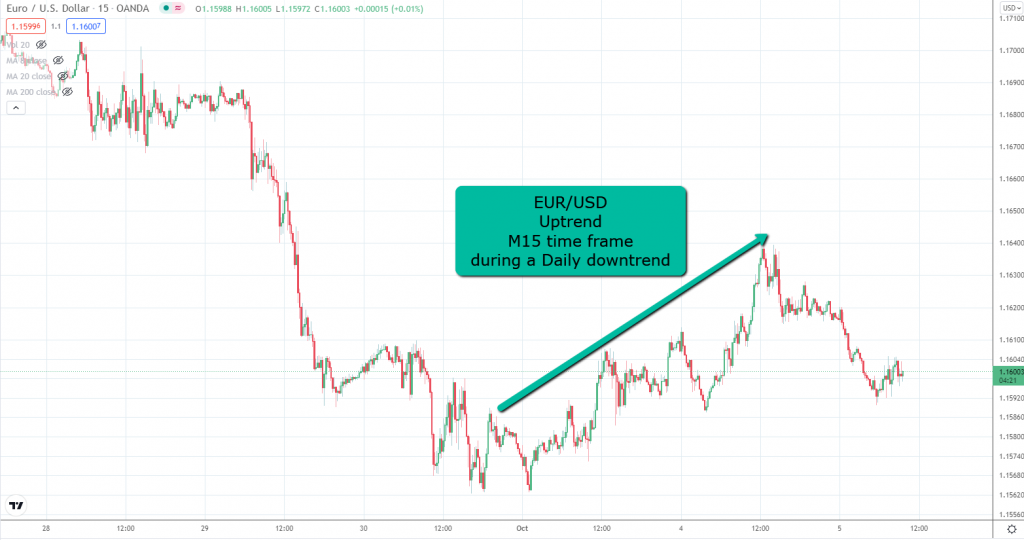
Do you see that beautiful uptrend?
You can go long there and take profits.
While you are shorting the market in the Daily time frame.
Does it make sense?
By doing this you are bullish and bearish at the same time in the same market.
Bullish and Bearish markets indicators
Let’s take a look at some of the most popular trend indicators.
Moving averages
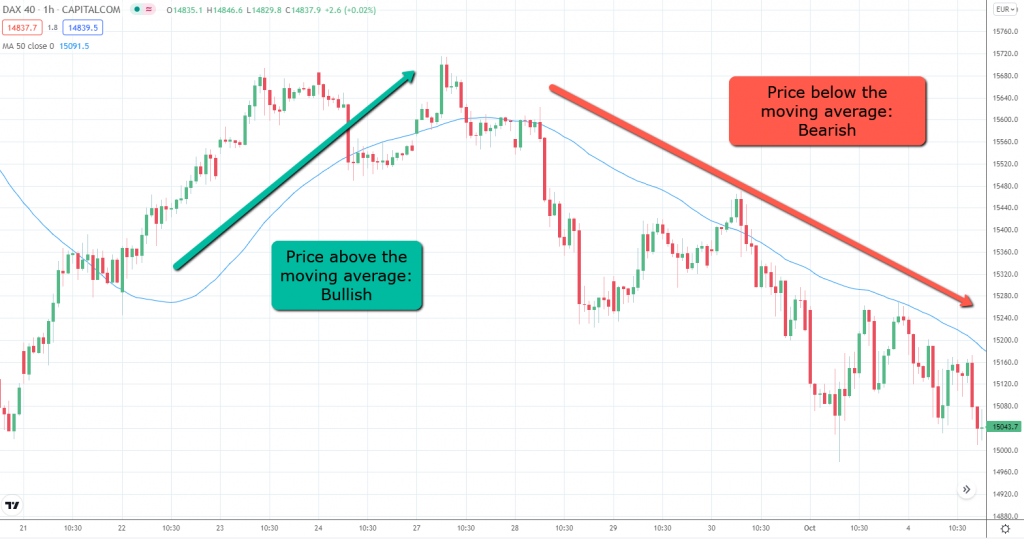
Moving averages are probably the most popular trend indicator.
Their use is simple, you should be bullish when the price is above the moving average.
And you should be bearish when the price is below the moving average.
Here’s an example:
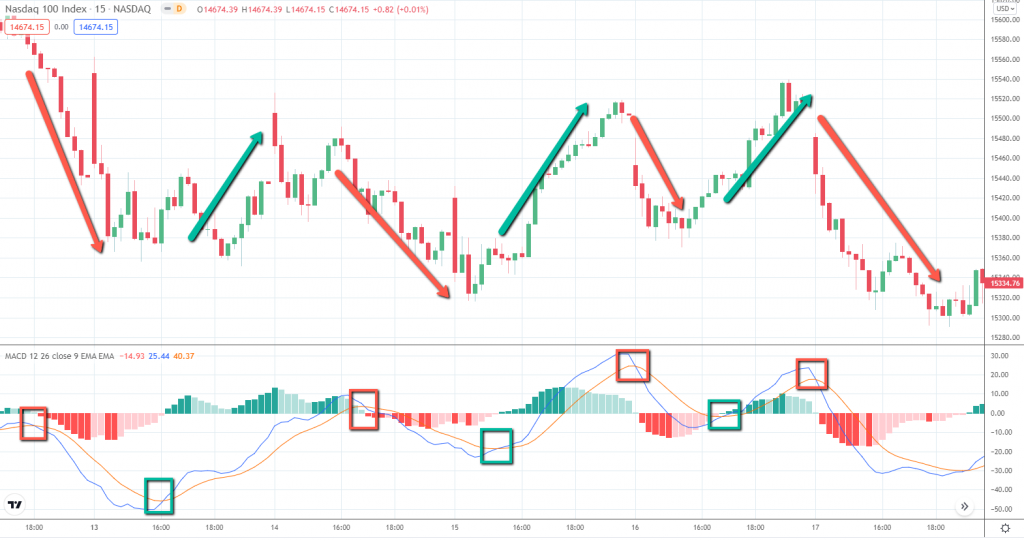
MACD
MACD is another popular trend indicator.
There are several ways of using it, one of them is the cross between the MACD line and the Signal line.
When the MACD line (blue) crosses the Signal line (yellow) to the downside, it indicates a possible bearish move.
When the MACD crosses the Signal line to the upside, it indicates a possible bullish move.
This is what it looks like:
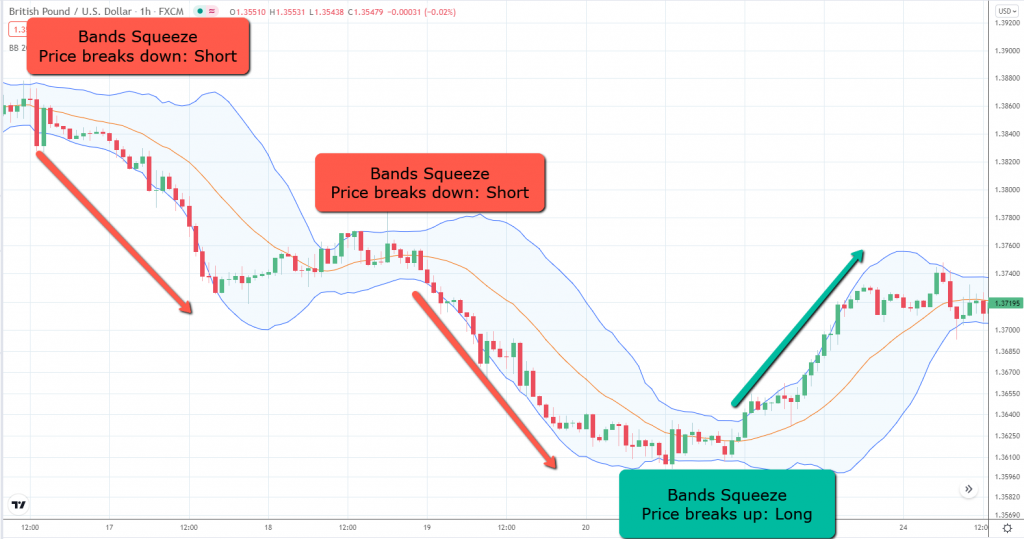
Bollinger bands
Bollinger bands have two bands that squeeze and expand.
Every time the bands squeeze, the price is moving sideways.
When the price breaks the squeeze zone to the downside, that’s a bearish signal.
If the squeeze zone is broken to the upside, that’s a bullish signal.
During the bullish or bearish trend, we should see the bands expanding.
It looks like this:
Detecting Trend Changes
How to detect a change from a Bullish to a Bearish market?
- Using moving averages: Wait for the price to cross the moving average from the upside to the downside.
- Using MACD: Wait for the MACD line to cross the Signal line to the downside.
- Using Bollinger Bands: Wait for a band squeeze and a price break to the downside.
- Using candle’s strength: Look for big candles in the opposite direction of the trend.
- Watch for bearish engulfing candlestick patterns appearing at market highs.
- Here you can learn more about how to detect the end of a trend.
- Using chart patterns: The most popular is the head and shoulders pattern.
How to detect a change from a Bearish to a Bullish market?
- Using moving averages: Wait for the price to cross the moving average from the downside to the upside.
- Using MACD: Wait for the MACD line to cross the Signal line to the upside.
- Using Bollinger Bands: Wait for a band squeeze and a price break to the upside.
- Using candle’s strength: Look for big candles showing strength to the upside.
- Watch for bullish engulfing candlestick patterns appearing at market lows.
- Using chart patterns: The most popular is the inverted head and shoulders pattern.
Trend Traps
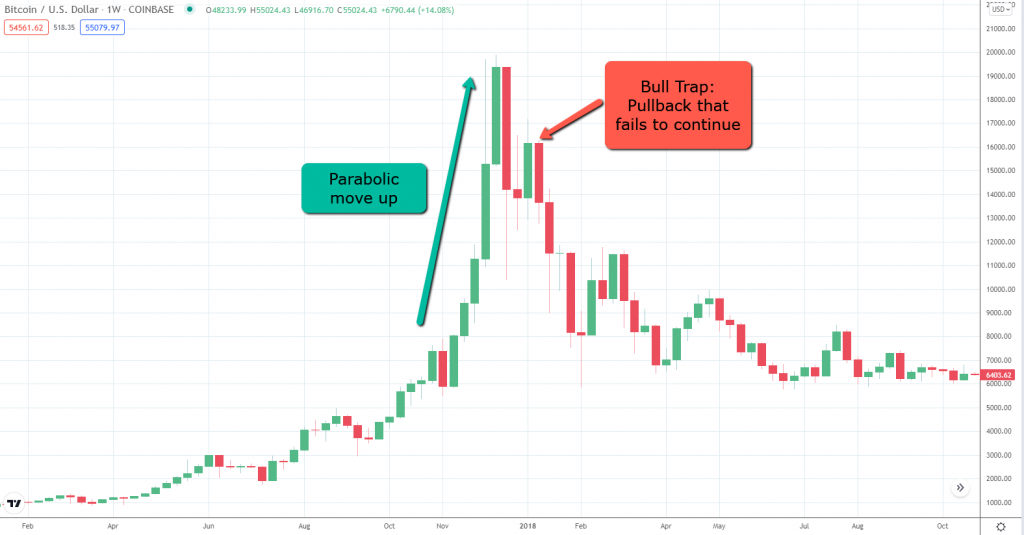
What is a Bull Trap?
Let me ask you…
Have you ever bought something because the price was going up parabolically?
During a big hype.
Just to see the price collapsing right away?
Probably you fell into a bull trap.
A bull trap is a chart pattern that often appears right after the end of an uptrend.
Usually after an exhaustion of the price.
As the name states, it will trap traders that are bullish on the markets.
What would you do if you bought something that went up parabolically?
Take profits, right?
Well, that’s what most traders do.
But the late ones…
They try to enter the race right at the end…
They wait for a pullback and then…
They get trapped!
The price just collapses as no one else is interested in buying it.
This is what it looks like in a chart:
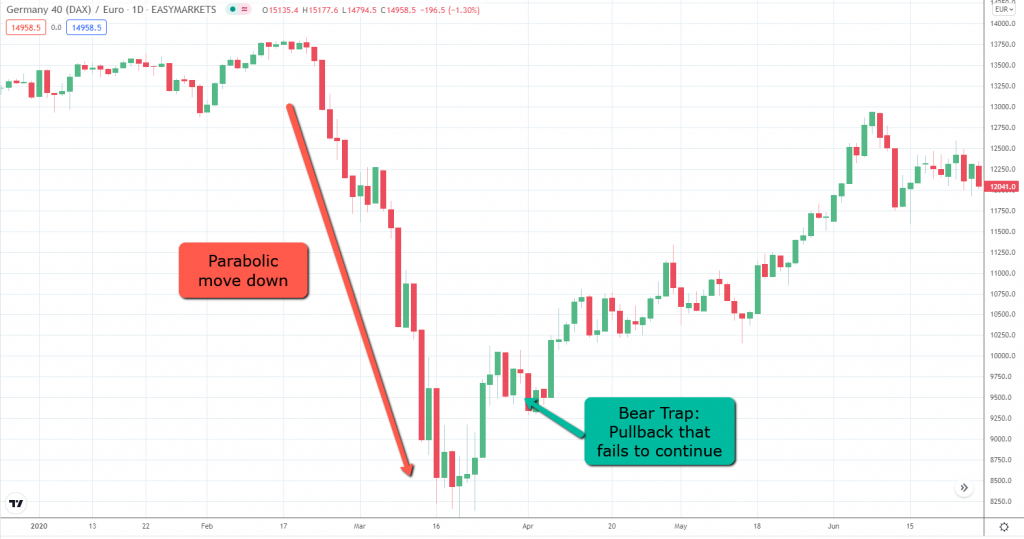
What is a Bear Trap?
A Bear Trap is similar to a Bull Trap but appears in the opposite direction.
Remember the COVID market crash?
Well, a lot of people started to sell their positions.
And as the price kept dropping…
More and more people kept selling to avoid big red losses.
And you know what this leads to…
Rollercoaster drop!
At some point, the market gets rid of all these traders.
And that’s when the bull traders appear, to take control again.
Who’s waiting to short the market after a huge drop?
Retail traders!
And then they get trapped in the Bear trap.
This is how it looks in a chart:
How To Invest in Bull and Bear markets?
Where should you invest during a bull market?
Markets are cyclic.
They change between bull and bear cycles.
During a bull cycle, consumers tend to have money to spend.
And where do they spend it?
They travel…
Buy smartphones…
Look for new houses…
Switch to new cars…
You get the point.
So, what are the best stocks to buy?
Here are the sectors that tend to perform better during a bull market.
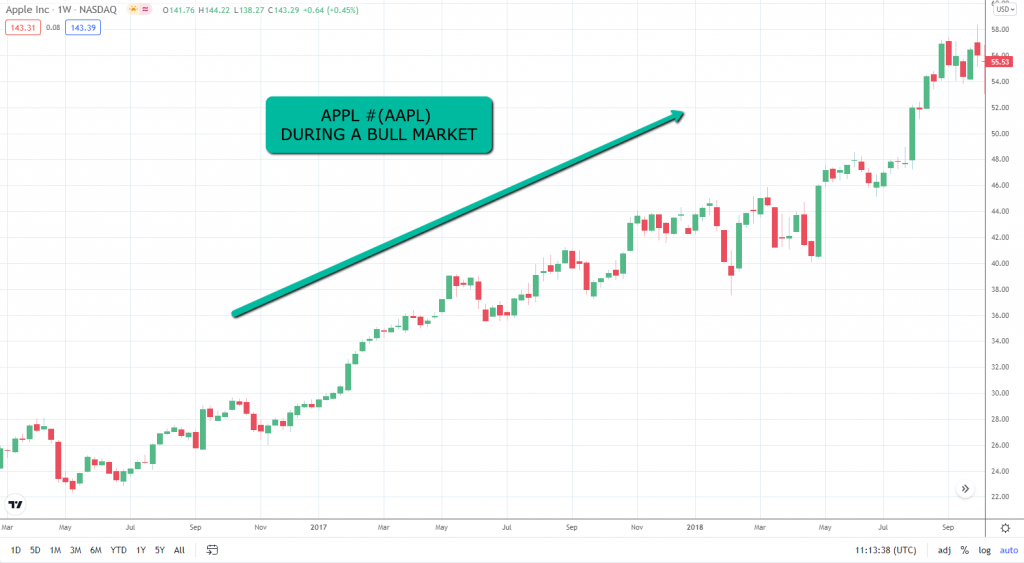
Tech Stocks
Every company that sells technology will very likely have great returns.
That will attract a lot of investors.
Either buying smartphones, TVs, computers, and all kinds of gadgets.
Money will be spent and that will make the company grow.
Here’s an example of Apple (#AAPL) stock prices during a bull market:
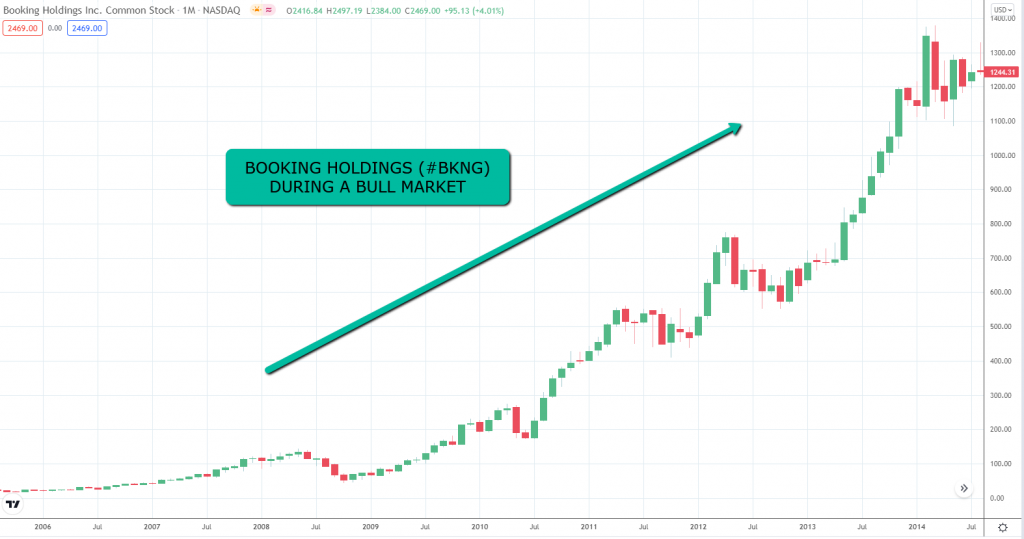
Travel Companies
When there’s money available, people want to travel.
I do.
And I bet that you too.
From airlines to hotels or short-term rentals to amusement parks, all tend to perform very well during bull markets.
A few examples are Booking (#BKNG), Southwest Airlines (#LUV), Marriott Hotels (#MAR), Airbnb (#ABNB), Walt Disney (#DIS), and all the others related to this sector.
Here’s Booking Holdings during a bull market:
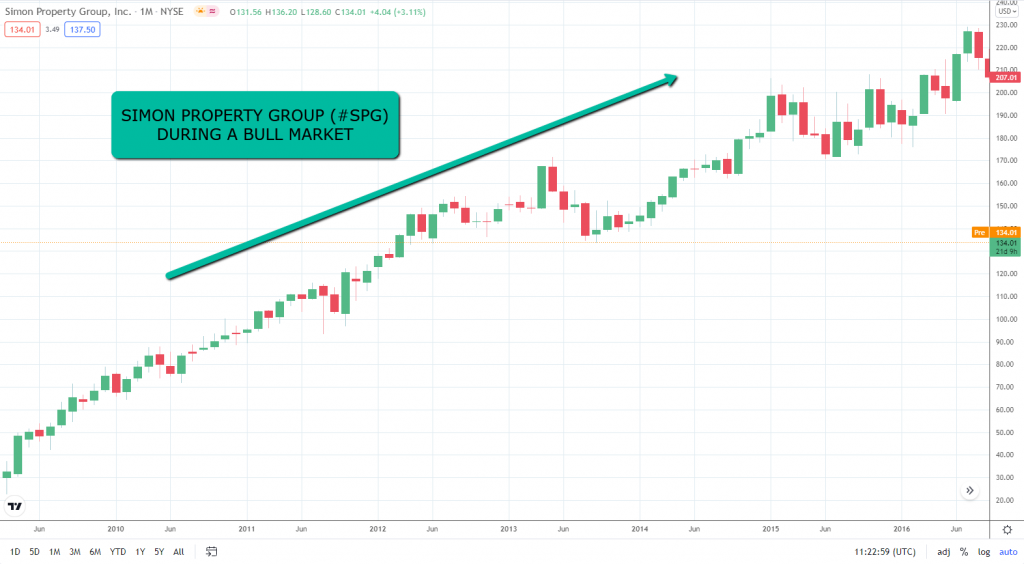
Real Estate and Construction Companies
When money is easy to get, people tend to buy houses.
This is especially true when we are coming out from a recession.
Interest rates will be low which will attract real estate investors.
This is a great sector to invest in during bull markets.
Here’s an example from Simon Property Group (#SPG):
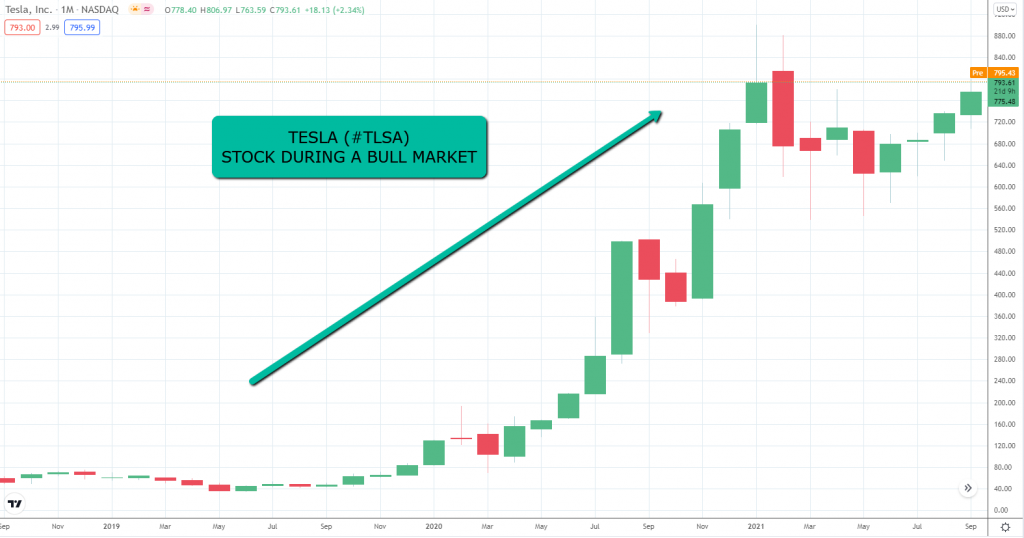
Automobile Manufacturers
This sector is one of the fastest ones to recover after a bear market.
And with all the major companies looking to go green, with electric vehicles, I have to show the monster Tesla (#TSLA) stock during a bull market:
Where should you invest during a recession?
Recessions typically create bear markets.
But you know what, not all markets are affected negatively during a recession.
CNN reported that during the recession in 2008, there were 25 companies from the S&P500 that had green returns.
At the same time, the vast majority of the companies were experiencing big losses.
Do you know what kind of companies had profits during the recession?
Consumer-related companies!
Stocks from companies that benefit from people that are losing buying power.
Let’s look at the sectors.
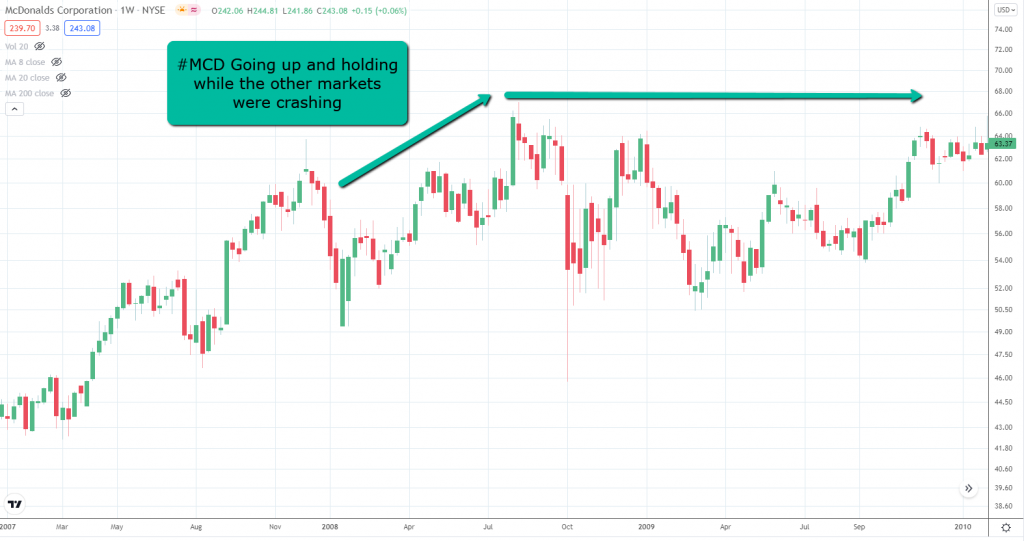
Food and Restaurants Industry
Food is something that people always need.
They can cut on a lot of non-essential expenses but not on food.
Well, they can, but only until a certain point.
Although they can stop spending money on expensive restaurants, fast-food companies tend to do very well doing recessions.
Why?
Because they are not expensive.
Restaurant chains like McDonald’s (#MCD) and similar tend to perform well during recessions.
In the same way, companies that sell packaged food and groceries also tend to increase their value during turbulent times.
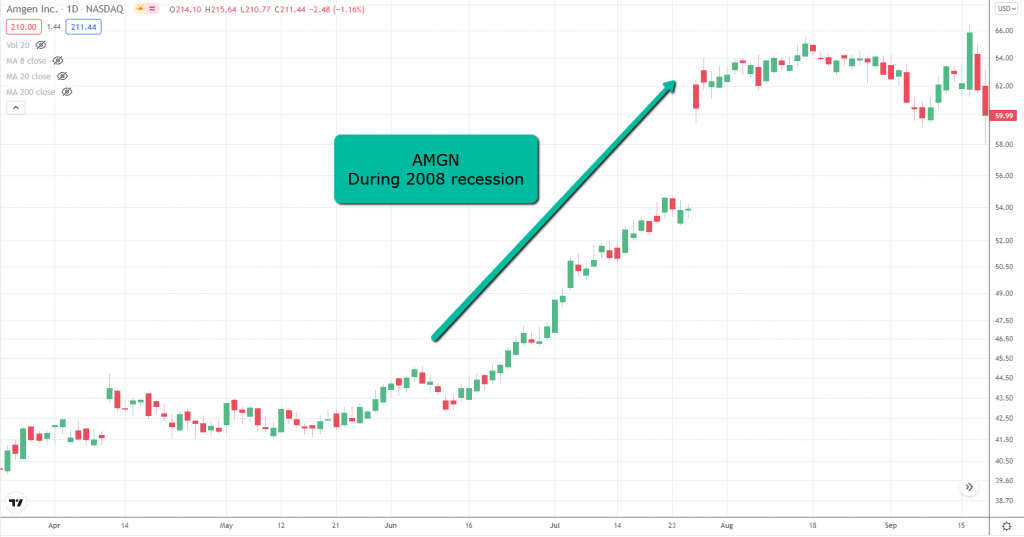
Health Industry
This one should be obvious.
People need health care to live.
The health sector includes:
- Medical services
- Manufacture of medical equipment and drugs
- Medical insurance
The key here is to go with well-established companies.
These companies usually also have low debt and enough cash to absorb eventual losses.
Startups usually have high debt, and a recession may affect them negatively.
Even worse, it can wipe them out completely.
The biotech and biopharmaceutical companies also tend to perform well.
Companies like Amgen (#AMGN) had great returns during the 2008 recession.
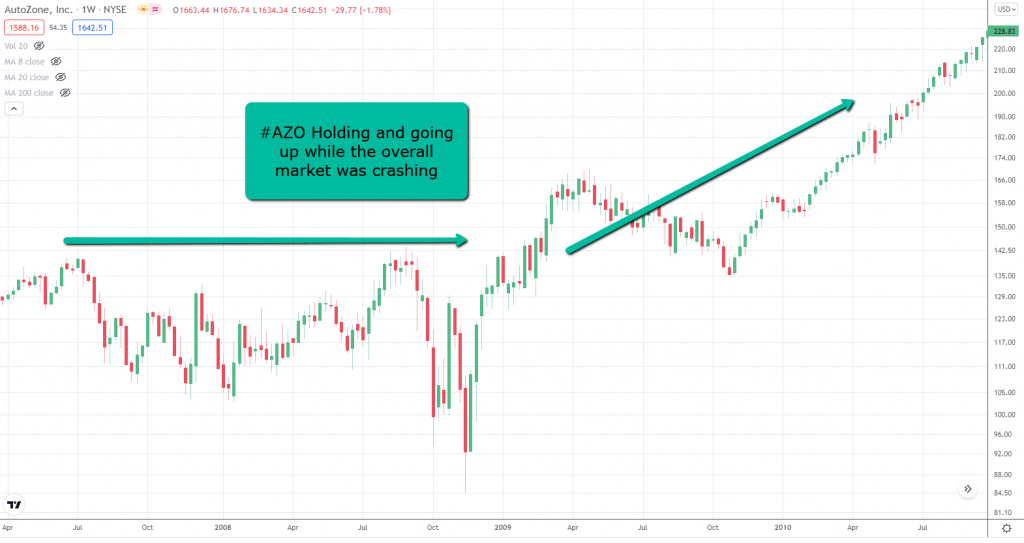
Auto Parts and Accessories Retailers
The overall auto industry will tend to plummet during recessions.
The vast majority of people will stop buying new cars.
The solution?
Repair their own cars!
For this reason, companies like AutoZone (#AZO), which sells auto parts and accessories, tend to get an increase in sales.
It’s much cheaper to repair your own car than send it to the repair shop, not to mention buy a new one.
DIY and Home Repairs
The reason is similar to the auto parts.
To cut expenses, people tend to do their own home and garden repairs or improvements.
On the other hand, home builders will tend to have a hard time.
Bank lendings get hard to get and home sales will just tend to crash.
Be careful and stay away from these companies during a recession.
Recap
Here’s what you learned today:
- A bull market is a market that goes up over time.
- A bear market is a market that goes down over time.
- You can trade trending markets by drawing trendlines, channels, and Fibonacci.
- You can trade trending markets using indicators like Moving Averages, MACD, and RSI.
- An Overbought market is a market that went up for a long time and might be about to start going down.
- An Oversold market is a market that went down for a long time and might be about to start going up.
- How you can detect the end of a trend using chart analysis and indicators.
- What are bull and bear traps and how to spot them.
- How should you invest in bull and bear markets.
Now, here’s what I want to know…
How do you trade trending markets and what are your favorite indicators?
Let me know your thoughts in the comments below!