
Let me tell you…
Chart patterns are incredible to understand what’s happening in the markets.
The Ascending Triangle is one that I really love.
Why?
Because it often triggers explosive moves when I’m day trading.
It’s a very powerful pattern when you know how to use it correctly.
In this blog post, you’ll learn everything about the Ascending Triangle.
And that includes how to trade it, step by step.
Today you’ll learn:
- What is an ascending triangle?
- What does the ascending triangle tell you?
- What makes the ascending triangle so powerful and explosive
- Difference between an ascending and descending triangle
- Mistakes to avoid trading the ascending triangle
- 5 ways of trading the ascending triangle
- How to protect yourself trading the ascending triangle
- How to maximize your profits trading the ascending triangle
Let’s get into all the details.
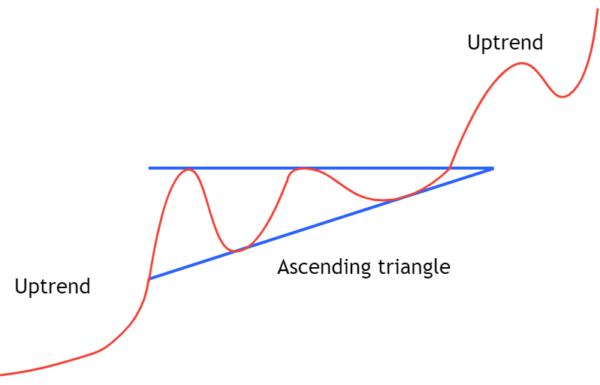
What is an Ascending Triangle?
The Ascending Triangle pattern is a bullish signal.
It tells you that the market is about to go up.
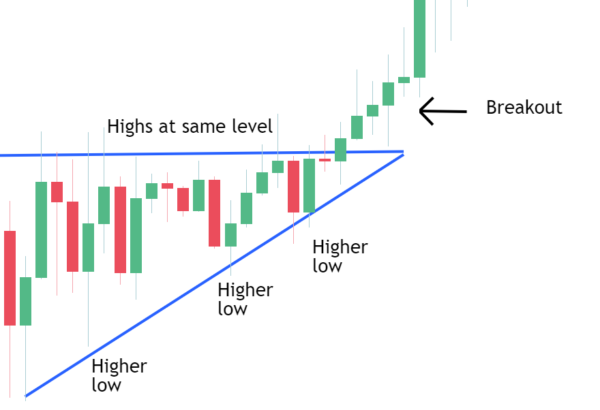
You can identify the Ascending Triangle by spotting these signs on your charts:
- The price is not making new highs, instead, it’s making highs at the same level
- The price is making higher lows.
- The range of the movement gets tighter with each oscillation
It looks like this:
What does the Ascending Triangle tell you?
An Ascending Triangle is typically a bullish signal.
Why?
Three reasons:
1 – There’s no selling pressure
What happens when there’s a lot of selling pressure?
The price drops, right?
And what we see here is…
The price forms a resistance zone.
Keeps hitting it.
But there are no big moves to the downside after those hits.
Actually, the drops are smaller every time the resistance is hit.
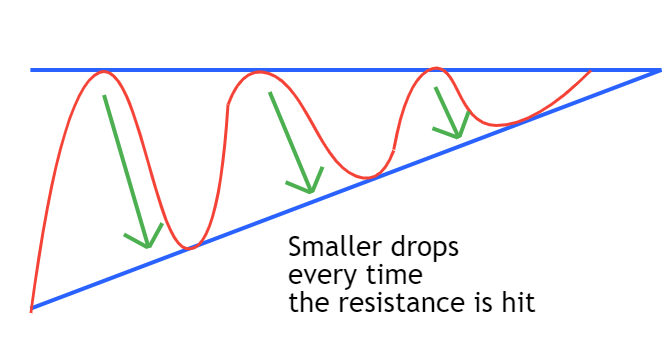
And this leads us to the next point.
2 – The buyers are still in control
Why?
Because the lows are getting higher on each oscillation.
Meaning that the buyers are winning the battle.
Absorbing any effort that the sellers make to through the price down.
Every new low is higher than the previous one.
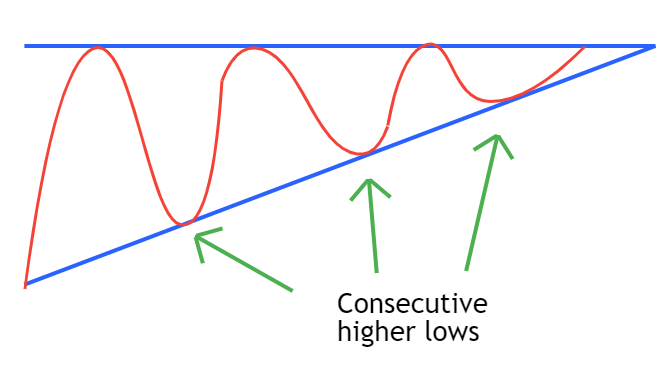
The buyers are paying higher prices as time passes and we get closer to the end of the triangle.
We are still in a bullish market, accumulating the most possible, before the explosive breakout.
Why explosive?
Because…
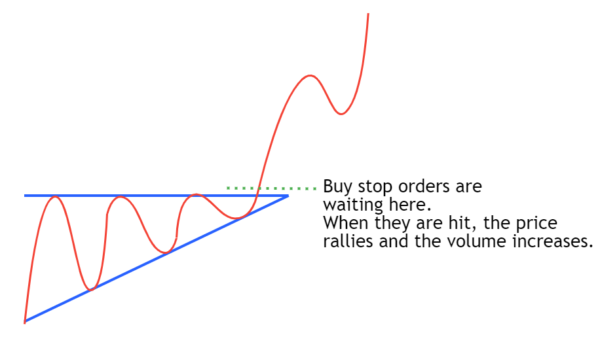
3 – Breakout buyers are waiting for the party too
Once an Ascending Triangle is broken to the upside, traders tend to aggressively buy the asset.
And when this happens…
A surge in the volume of transactions appears.
This volume increase confirms the breakout of the pattern.
It shows a high interest in the continuation of the movement after the break of the pattern.
What makes an Ascending Triangle so powerful and explosive?
Let’s say that you are inflating the tires of your car.
Or even of your bike.
Every time that you put more air into it, the pressure increases.
That’s what’s happening inside the ascending triangle.
More and more buyers are accumulating into their positions.
The sellers are being absorbed completely as the price keeps making higher lows.
At some point, the range is so tight…
The tires are so inflated…
That they just explode.
And throw the price into the sky.
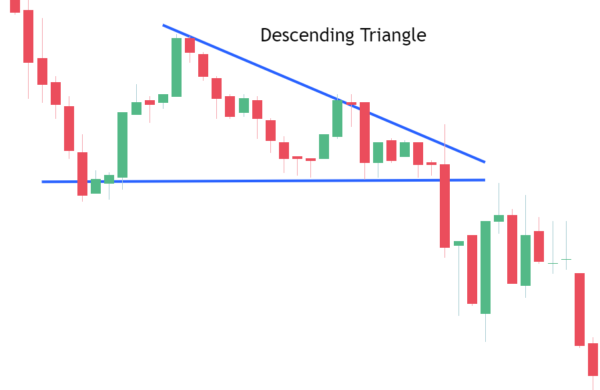
Difference between an Ascending Triangle and a Descending Triangle
While an Ascending Triangle is a potential sign of a bullish movement.
A Descending Triangle is exactly the opposite.
It’s an accumulation before a bearish movement.
It’s a sign that the price may be about to drop really fast.
They look like this in your charts:
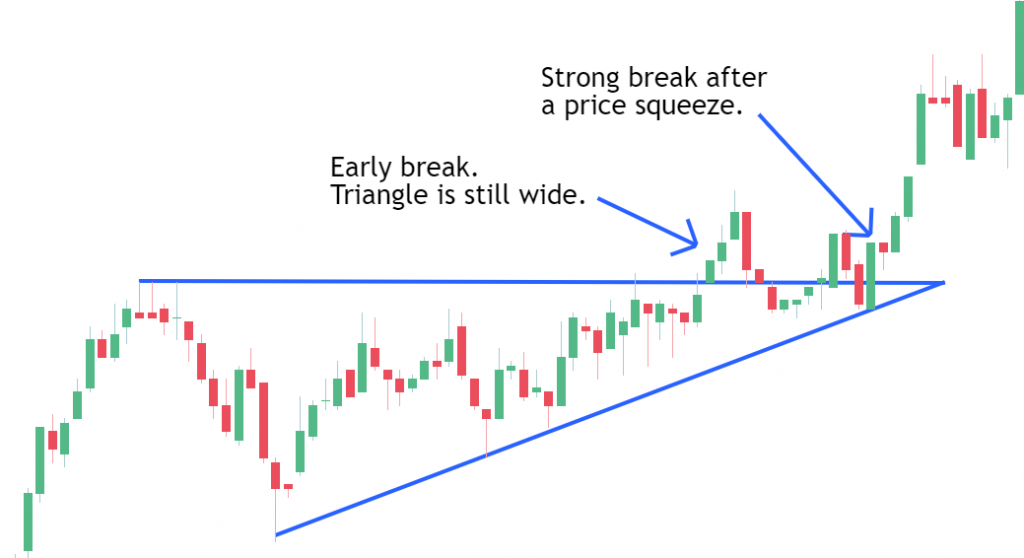
Don’t make these mistakes trading the Ascending Triangle!
1 – Entering the trade too soon, before the price gets squeezed inside the triangle
Most traders are always eager to trade.
Or at least the retail traders.
You know what I mean, right?
When you see a pattern forming you just want to trade it no matter what.
As soon as possible…
I truly understand you.
I’ve been there too.
But you know…
You may be right about what’s going to happen.
But if you don’t wait for the right time to act.
Then you are wrong.
When trading an ascending triangle we should wait for the price to compress the most possible.
To reach the end of the triangle until it can’t move more without breaking it.
Any other attempt of the price to break the triangle will have lower odds of success.
Which may make you get unnecessary losses.
Here’s an example of an early breakout before the price is really compressed inside the triangle:
2 – Shorting because the price is hitting a resistance
You learn from technical analysis books that you should short resistances and buy supports.
But let me tell you…
This is not valid for every situation.
Some resistances are not to be shorted.
This is what I mean…
Ascending triangles form a resistance at the top.
Look at this example:
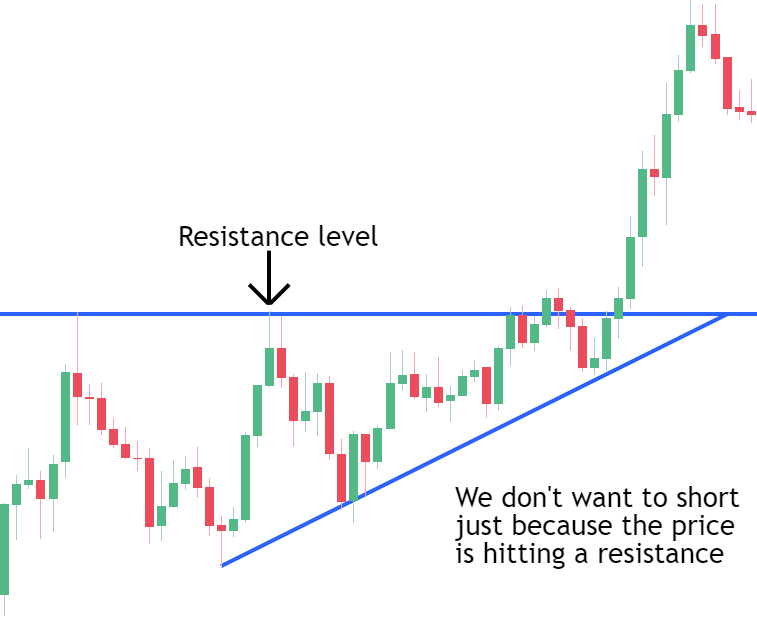
Should you short this resistance?
No!
The seller’s strength decreases every time that the price touches it.
And the buyer’s strength increases.
That’s why the higher lows appear.
These kinds of resistances will likely fail.
Instead of waiting for shorting opportunities.
Expect a breakout to the upside.
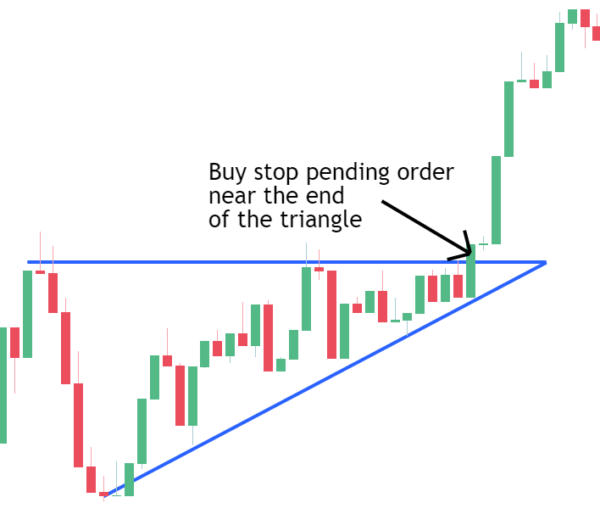
How to trade the Ascending Triangle Pattern – 5 Strategies
Buy-Stop Order
This is the most simple way of trading the ascending triangle.
And most aggressive too…
Ascending triangles work well as a bullish pattern because buyers are willing to buy at high prices.
At the top of the triangle, there’s a cluster of buy-stop orders waiting to be hit.
Now, the thing is…
When should you set your buy-stop order?
You know…
The price will touch the resistance several times before the breakout.
All these times there will be a fake breakout.
And that can hurt you…
In the early breaks, your stop loss would probably be big.
Instead…
Wait for the price to approach the left end of the triangle.
That’s when the price is completely compressed.
And ready for an explosion to the upside.
Here’s an example:
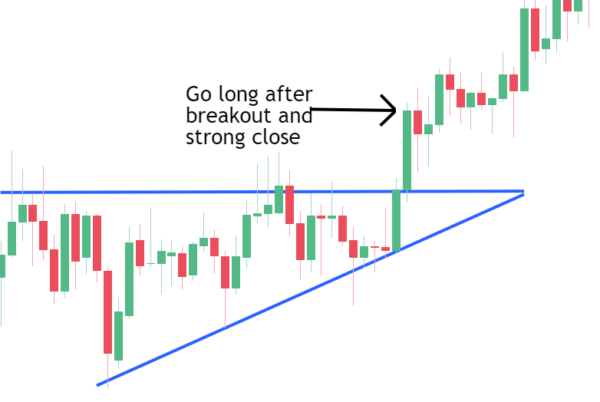
Breakout and strong close
As traders, we should always follow the strength.
A strong, big, solid candle, breaking the top of an ascending triangle, is a sign of strength to the upside.
These candles tend to have much more volume than the previous ones too.
Why?
Because that was the ultimate fight between sellers and buyers.
And buyers won the battle.
When you see this breakout appearing.
That’s when the timing is good to go long.
And ride that uptrend that has just begun.
This is how it looks:
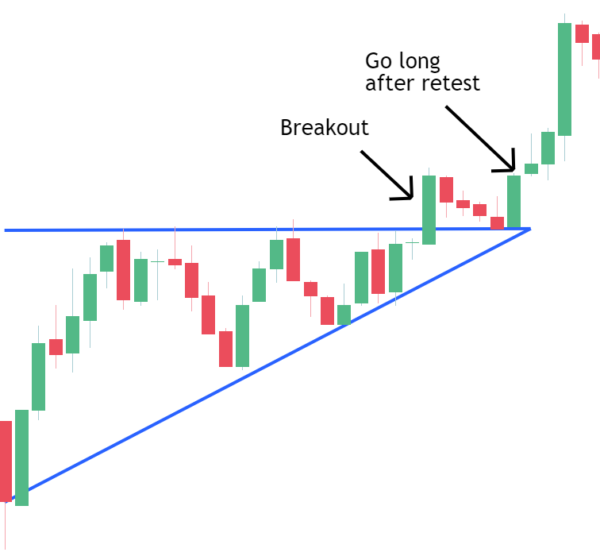
Breakout and retest
This is a conservative way of trading the ascending triangle chart pattern.
First, we wait for the break.
Strong, solid candle, closing above the resistance.
Now, you don’t need to follow that candle immediately.
You know…
The price moves in waves.
The better entries appear when a wave up is starting.
Not when it’s at the top.
So, what to do?
Wait for confirmation.
The confirmation appears as a retest of the broken resistance.
And then rejection from that resistance.
Look at this example, the price is rejecting the resistance with a bullish engulfing pattern.
That’s a good and conservative way to open your trade.
Breakout to the downside and reversal
Do you think that ascending triangles are always broken to the upside?
No…
They are often broken to the downside too.
The thing is…
These breakouts are usually short-lived.
Think of them as a kind of shake.
Big boys don’t like to be followed by retail traders.
Like you and me.
So, they will do everything possible to stop us and profit from our losses.
And who will likely be stopped on a shake?
Traders that entered too early.
Trying a breakout far away from the right end of the triangle.
Not waiting for the right time to enter.
Here’s an example of a fake breakout to the downside.
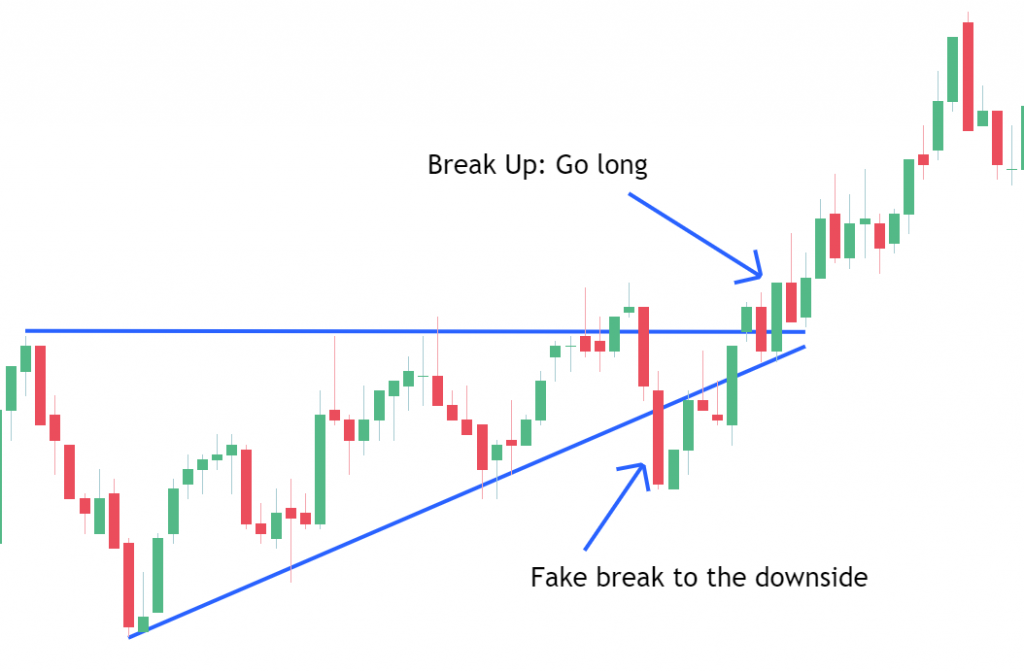
And what do you see after the fake breakout?
The price coming back up.
As fast as it came down.
And now what?
Wait for the real breakout to the upside.
That’s where the price will tend to rally.
Breakout anticipation
I love this way of trading the ascending triangle.
Anticipating the breakout.
The key here is…
You don’t want to anticipate the breakout at the top.
Instead…
You want to enter the lowest possible.
When the price is being rejected from the low of the triangle.
Which acts as a support.
Here’s an example:
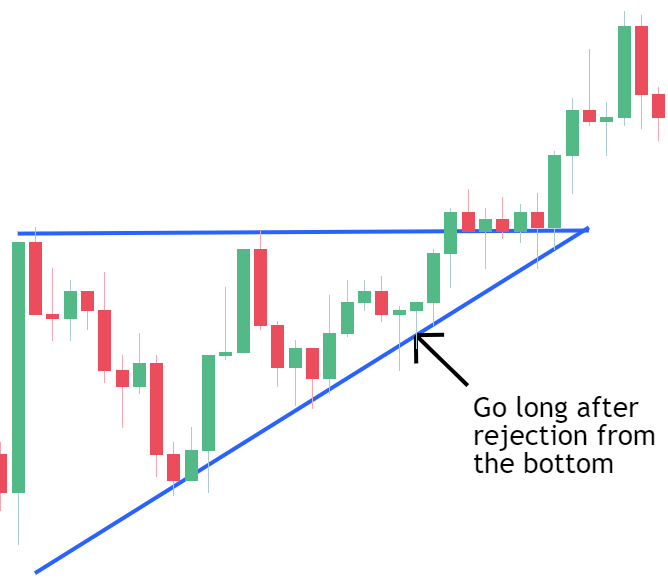
You see…
When you enter lower…
When you see that the breakout will likely be soon.
You have a better risk-reward on your trade.
You can still profit from the move inside the triangle.
Plus, the rally that will likely happen after the breakout with all the scalper traders there waiting for their orders to trigger.
Makes sense?
Ascending triangle in bullish and bearish markets
Ascending triangle uptrend continuation
Ascending triangles are a bullish signal.
And most of the time…
They tend to appear as a continuation of a previous bullish move.
They are a consolidation of the price.
Taking a breath before the next leg to the upside.
This is what they look like:
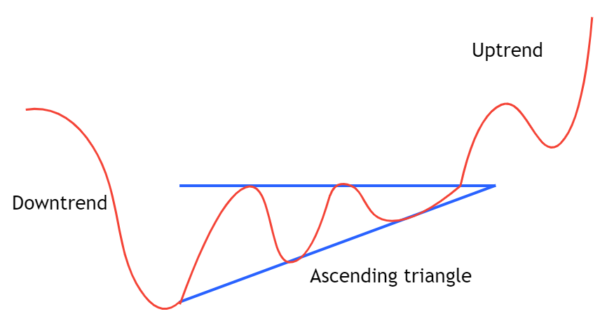
Ascending triangle downtrend reversal
What if we see an ascending triangle during a downtrend?
Well, you know…
Trends change all the time.
An ascending triangle can be seen as a way to spot the end of a trend.
Downtrends tend to stop when lower lows start to turn into higher lows.
That’s when a trend goes from bearish to bullish.
Exactly what happens during an ascending triangle consolidation.
So…
The meaning is the same as in an uptrend.
We should expect a bullish rally after the breakout of the top of the triangle.
Here’s how they look:
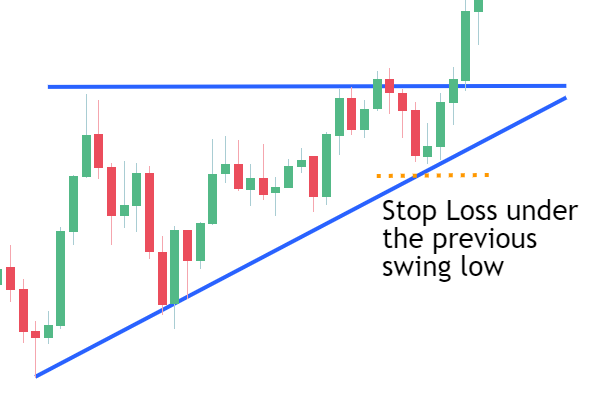
How to protect yourself trading the Ascending Triangle Pattern
Method #1 – For entries at the breakout or before the breakout
Let’s think together…
What happens at the bottom of an ascending triangle?
We have consecutive higher lows.
Right?
The safest way to set out stop loss is below the previous swing low.
The price is not supposed to come back to that low again.
Either if you enter at the breakout or anticipate it…
Your stop loss goes to the same place.
Under the previous swing low.
Looking like this:
But that’s not everything…
Let’s take a look at the next method.
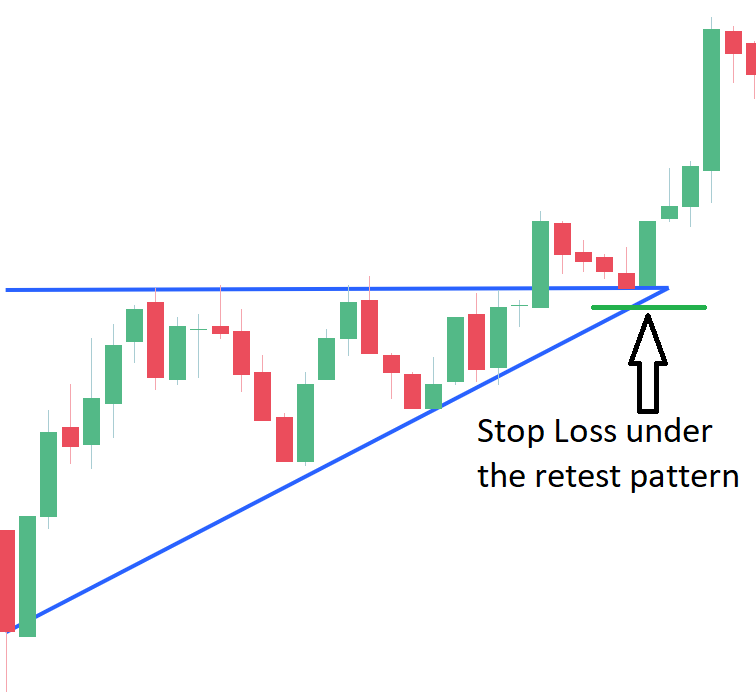
Method #2 – For entries after the retest of the resistance
What if we entered after a retest of the resistance?
The concept is the same.
Consecutive higher lows.
If you think about it…
The retest of the resistance is a swing low itself.
And for a small risk…
Just place the stop loss under the pattern that rested the resistance…
It will look like this:
When to take profits trading the Ascending Triangle Pattern
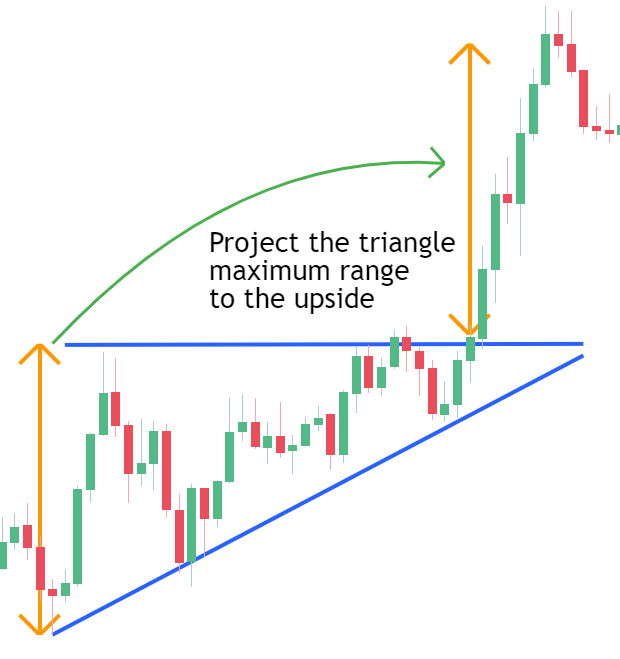
Method #1 – Projecting the price rally
This technique is about predicting the next possible exhaustion of the price.
It’s actually very simple.
You do it in three easy steps:
- Get the range of the wider side of the triangle.
- Make a projection of the range to the breakout zone.
- The top of that projection will be your target.
This is what it looks like:
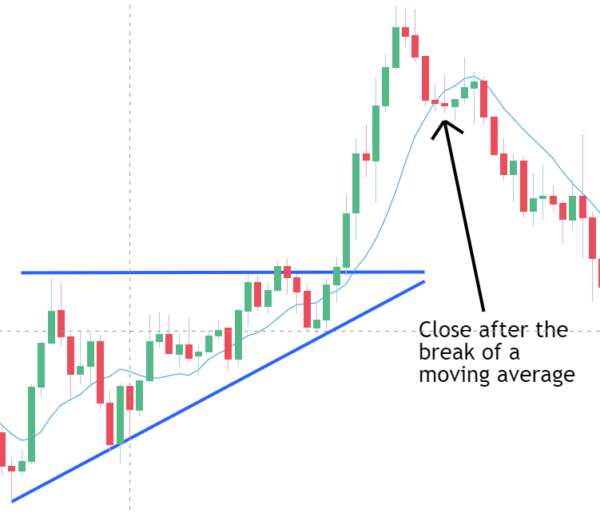
Method #2 – Using a moving average
Moving averages are trending indicators.
Whenever a price is trending up it tends to be above a moving average.
So, how do we use this to close our trades?
Simple…
Just let the price run.
While it’s still above the moving average don’t touch your trade.
When you see the price breaking the moving average to the downside just close your trade.
Here’s how it works on your charts:
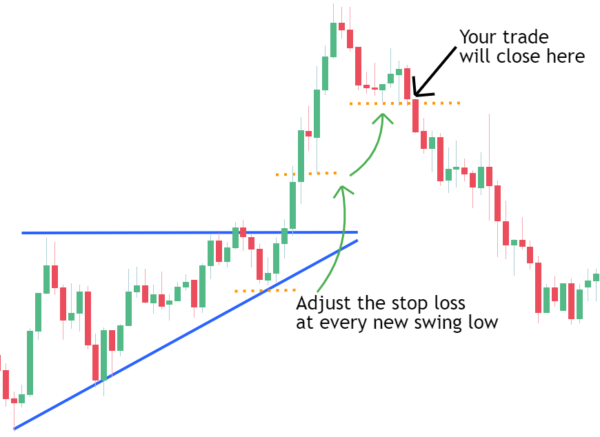
Method #3 – Trailing your stop loss on each swing low
This is a great way to ride your profits.
A lot of times you can squeeze a lot of an uptrend.
So, what are the steps?
- Place your initial stop loss below the previous swing low
- Every time that the price makes a pullback or pause adjust your stop loss to the low of that pullback
- Keep repeating
- When the price fails to make a new high and comes back down, your trade will close
Why does this work well?
Because the price just lost a previous low.
And that’s a signal of a potential trend reversal.
Similar to what we see on a double top or on a head and shoulders pattern.
It should look like this on your charts:
Recap of what you learned today:
- An Ascending Triangle is a chart pattern formed by consecutive higher lows and highs at the same level.
- It signals a possible bullish move after a breakout.
- Avoid trading them too soon, wait for the real breakout.
- It’s risky to short. Don’t do it just because the pattern is forming resistance at the top.
- You can trade them with a buy-stop order, breakout and strong close, breakout and retest, a fake breakout to the downside and reversal, and breakout anticipation.
- Ascending triangles are also a signal of a bearish to a bullish trend reversal.
- How to protect yourself by placing the stop loss at the right places.
- When to take profits and the best ways to manage your trades.
Now I want to hear from you.
What is your favorite way of trading this pattern?
Let me know below in the comments.