
The Golden Cross chart pattern is one of the easiest patterns to identify on your charts.
However…
Almost all new traders get it wrong.
They commit the same mistakes over and over.
Why?
Because they just jump in.
Without a reliable trading strategy to get the most out of this chart pattern potential.
That’s why today you’ll learn:
- What is a Golden Cross pattern in trading?
- What does the Golden Cross tell you?
- Limitations of the Golden Cross pattern
- The 5 biggest mistakes trading the Golden Cross
- Golden Cross vs Death Cross
- The 3 stages of the golden cross
- Riding HUGE trends with the Golden Cross Signal
- 3 Golden Cross trading strategies
Sounds good?
Keep reading…
What is a Golden Cross pattern in trading?
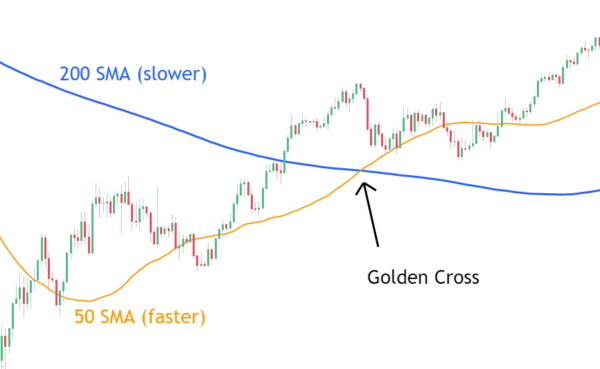
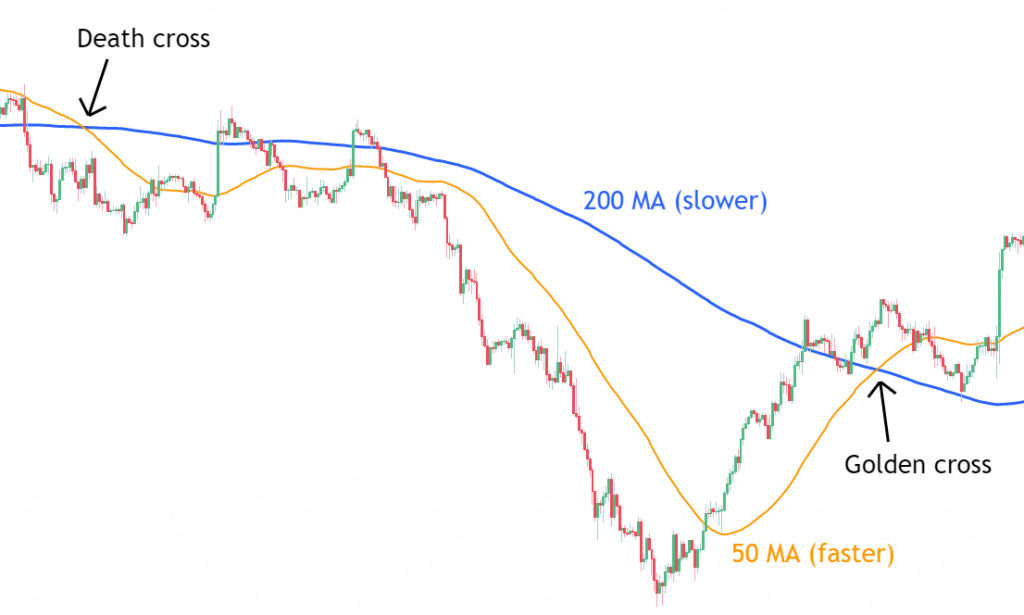
The Golden Cross is a chart pattern that is formed when two moving averages cross each other on a given time frame.
You want to see a faster moving average crossing a slower moving average to the upside.
Typically the moving averages are:
- 50 period MA as the faster moving average
- 200 period MA as the slower moving average
Here’s how they look on your charts:
What’s so special about these 50 and 200 periods?
Well…
Nothing…
You can use any periods that you want.
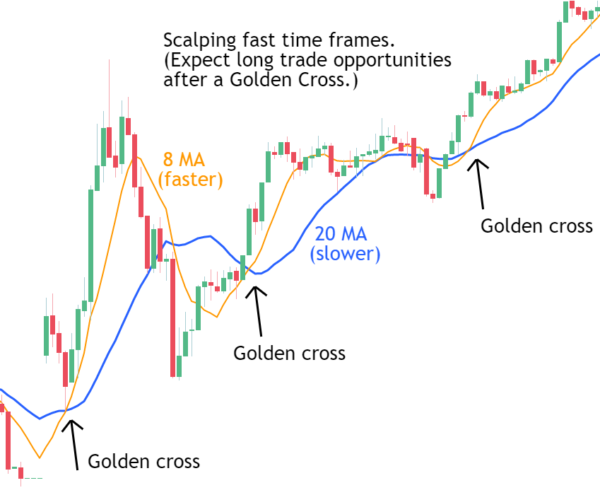
The 50 and 200 periods are usually used for longer-term trades.
I frequently use the 8 and 20 periods for scalping.
So, there’s no right answer here.
The important is the concept.
We have a slow moving average on a downtrend.
And then a fast moving average showing strength to the upside.
And that leads us to the next question.
What does the Golden Cross tell you?
A Golden Cross is seen as a bullish signal.
A way to detect a market change from bearish to bullish.
You know…
The markets don’t trend forever.
Downtrends turn into uptrends.
Uptrends turn into downtrends.
And a lot of times there’s no trend at all, just moving sideways.
When you see a fast moving average crossing a slow moving average to the upside, you are “officially” on an uptrend.
Here’s how I use them for scalping or day trading:
It seems simple, right?
It is.
But it has some limitations.
Limitations of the Golden Cross pattern
Similar to other indicators, the “signals” take some time to appear.
They lag.
Why?
Because they show you what the market did in the past candles.
Meaning that when you get a “signal”, it may already be late to enter the trade.
At least immediately.
You can take a trade based on that signal but first, wait for better conditions.
This leads us to the next chapter.
How you should NOT trade the Golden Cross pattern.
The 5 biggest mistakes trading the Golden Cross
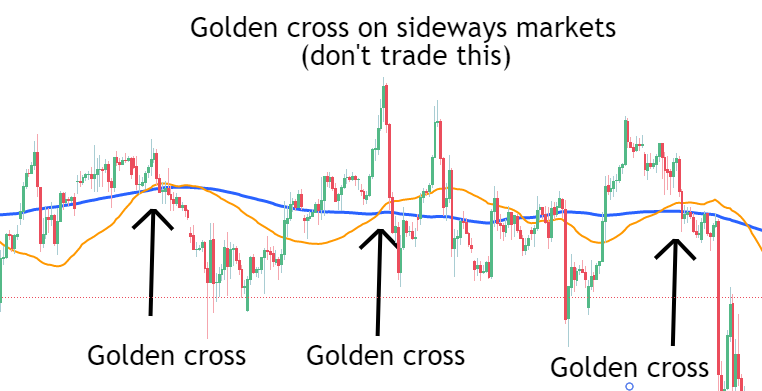
Mistake #1: Trading markets that are ranging sideways
You know…
A golden cross is a bullish signal.
And bullish is associated with an uptrend.
But, what if the markets are moving sideways?
We have no trend, right?
Sideways markets are always jumping to both sides of moving averages.
That’s exactly what you want to avoid when you are trading with trending strategies.
You’ll just fail most of the time.
In the same way that you would fail if you were trading a strategy for ranging markets on trending markets.
Stay away from markets like this one, when trading the golden cross pattern:
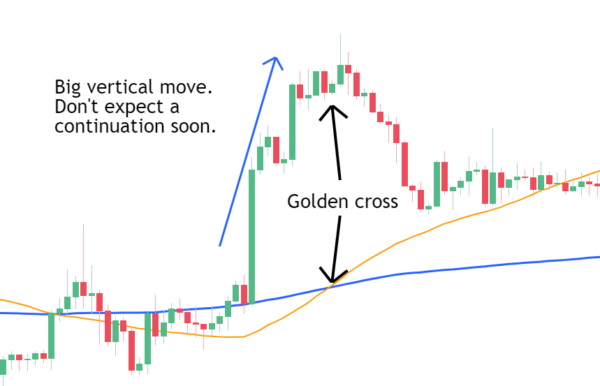
Mistake #2: Trading the Golden Cross after a big vertical move
Fast vertical moves are not healthy.
Why?
Because they frequently lead to price exhaustion.
Let me ask a question.
Let’s say that you are long on some market.
And then the price just makes a big rally.
What would you do?
Take profits, right?
That’s what all the traders that were pushing the price upwards will do either.
This will frequently lead to some kind of crash or big price correction.
And that’s exactly where you don’t want to trade when you see a gold cross.
How do you spot it on a chart?
Watch where the price is when the golden cross appears.
Is it very far away from the fast moving average?
If so, better wait for a good opportunity at lower prices.
Here’s an example of a golden cross appearing at price exhaustion:
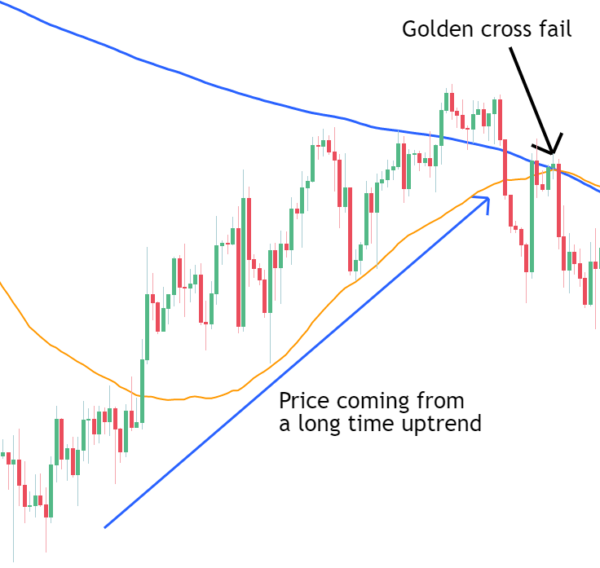
Mistake #3: Price coming from a long time uptrend
This is an extreme example of the golden cross pattern lagging.
In the previous example, we had the price very far away from the fast moving average.
Now let’s look at the distance between both moving averages.
Imagine a downtrend…
I mean, a strong one that lasted for a long time.
What happens to the moving averages?
They get very far away from each other.
At some point, the price will start coming back up.
It breaks the fast moving average.
And then, both, the price and fast moving average, start heading to the slow moving average.
This will create a long uptrend before the golden cross appears.
And you know…
The slow moving average is a resistance itself.
After a long uptrend the price may tend to feel it and change the trend again.
In a scenario like this, it’s better to wait for the break and consolidation of the price above the slow moving average.
More on this later in this post.
Meanwhile, here’s an example of a long uptrend before a golden cross failed signal:
Mistake #4: Entering your trade at the top before a pullback
Do you know what makes the moving averages go up?
Bullish candles bigger than bearish candles over a certain period of time.
And the bigger the candle, the bigger the moving average step to the upside.
Now, what does this have to do with the golden cross?
Well…
A big move to the upside will make the fast moving average move faster.
And that’s when the cross may tend to appear a lot of times.
Here’s an example:
So should you enter there immediately?
No!
Why?
Because after a big move up, the price will tend to make a correction to the downside.
And there’s no need for you to try to survive that pullback.
Worse part?
You’d need a big stop loss and your reward will be potentially smaller.
So, what’s the solution?
Wait for the pullback.
That’s where you should start thinking about going long.
And catch the next leg up.
Makes sense?
Let’s go to the next mistake.
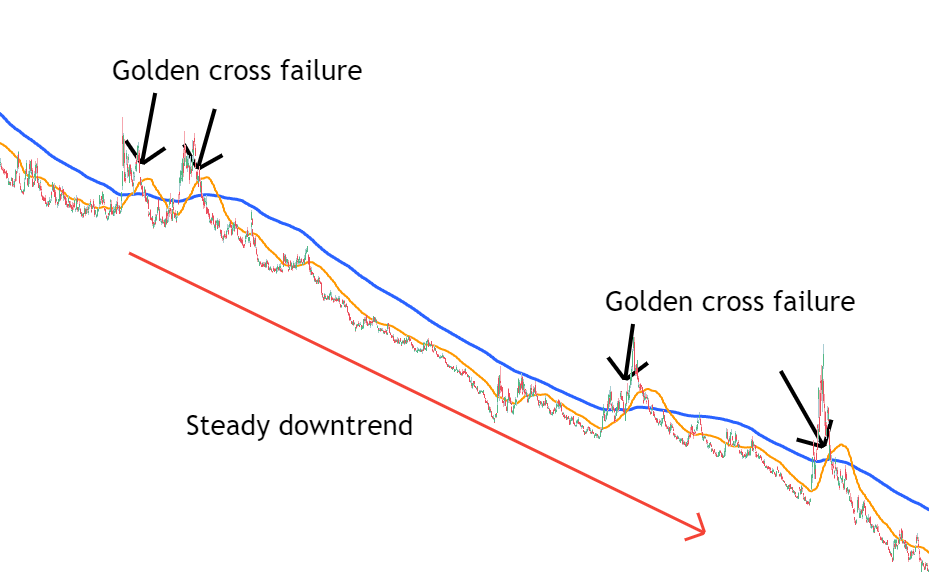
Mistake #5: Trading golden crosses on steady down-trending markets
Do you know what the best trends are?
The ones that move on a 45º slope.
With the slow moving average parallel to the fast moving average.
Those are stable trends that will tend to continue.
Very different than bigger moves
That throws the price far away from the moving averages.
Making the fast moving average also get far away from the slow moving average.
And then the price will tend to exhaust and change the trend.
So, what’s the key here?
Be careful with golden crosses appearing against steady downtrends.
They will tend to fail a lot of times.
Here are a few examples:
Golden Cross vs Death Cross
A Death Cross is nothing more than the opposite of a Golden Cross.
It signals a possible future bearish market.
So, how do you use them?
- Golden cross: use it to filter your trades focusing on the long side.
- Death cross: time to focus on the short side.
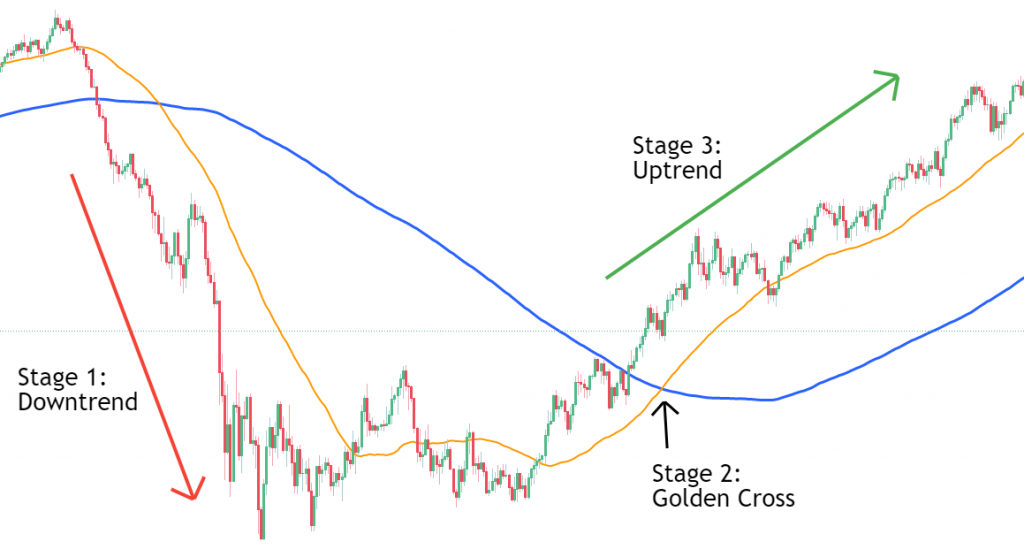
The 3 stages of the Golden Cross
A Golden Cross has 3 stages that you need to be aware of.
Stage 1:
The price is on a downtrend, moving below the slow moving average.
The further away it gets from the moving averages the best.
And then, wait for the price to stop going down.
Start to get closer to the slow moving average.
That’s where we get to…
Stage 2:
Wait for the price to cross the slow moving average.
That’s where the Golden Cross will tend to appear.
The fast moving average will follow the price.
Crossing the slow moving average to the upside.
The Gloden cross is confirmed.
Stage 3:
Ride the next trend to the upside.
A Golden Cross is a bullish signal.
At this point, we have everything above the moving averages.
Change your bias to the upside.
And start thinking about going long, forgetting the short side.
Here are the stages on a chart:
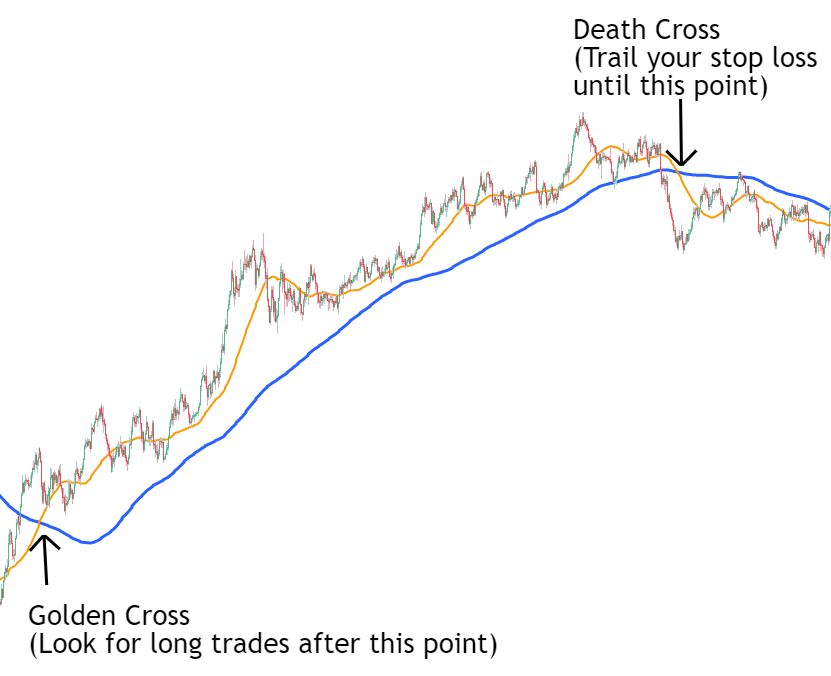
Riding HUGE trends with the Golden Cross Signal
Here’s a way that I love to trade.
When the price is above the moving average what’s your bias?
The upside, right?
So…
Why would you close your long trade while the market is still showing a bullish continuation?
Keep riding that trend!
To maximize your profits to the most possible.
And how to do that?
Simple, wait for a bearish signal!
Use bearish signals to close long trades.
A bearish signal is nothing more than the Death Cross.
You just need to have the patience (and time) to hold your trades.
Riding your trades like that is one of the best ways to catch huge trends and grab huge profits.
Here’s an example of how to ride an uptrend:
But there’s a catch.
These things don’t work all the time.
Several times you won’t catch big moves.
Your trades may close quickly if there’s a bearish signal close to the Golden Cross bullish signal.
But think about the long term, that’s what matters.
And if you take advantage of the previous tips, to avoid mistakes trading the Golden Cross, you have what it takes to be able to ride big trends.
Now let’s move on to the trading strategies.
How to use the Golden Cross: Trading Strategies
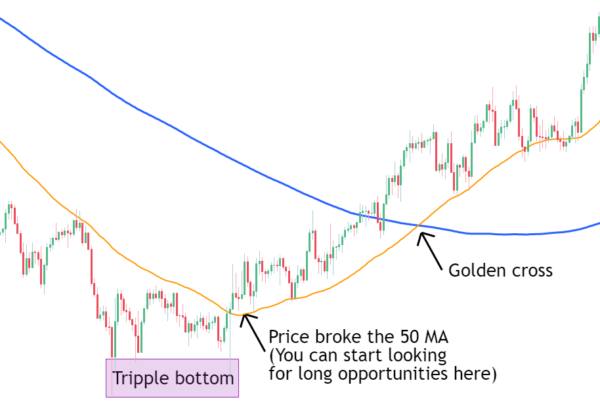
Strategy #1: Anticipating the Golden Cross
All indicators lag.
Period.
And a chart pattern like the Golden Cross, which appears using indicators, will also lag.
But we can anticipate that lag!
How?
First, we need a strong downtrend.
Making the fast moving average get far away from the slow moving average.
Then we wait for the price to break the fast moving average to the upside.
And then…
We can change our bias to go long.
Wait…
But shouldn’t we always wait for the Golden Cross to go long?
Well, not always.
When we have enough space between the fast and slow moving averages, we can start going long earlier.
The fast moving average will tend to start going up as the price crosses it to the upside.
And if we had some reversal pattern, like a head and shoulders, or a double or even triple bottom, that should give us more confidence in a trend change.
This is an example of how it should look on your charts:
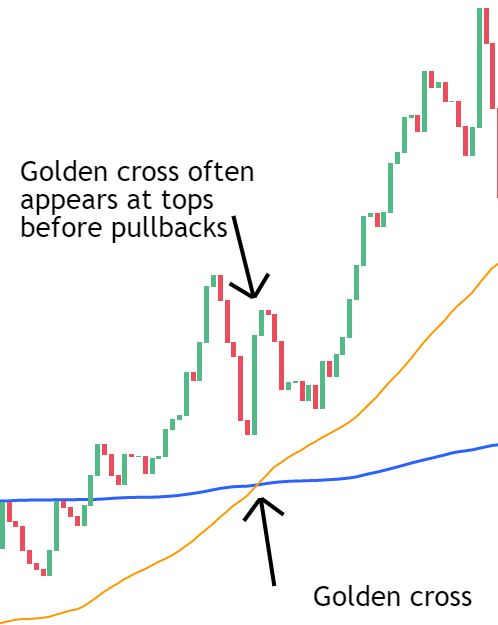
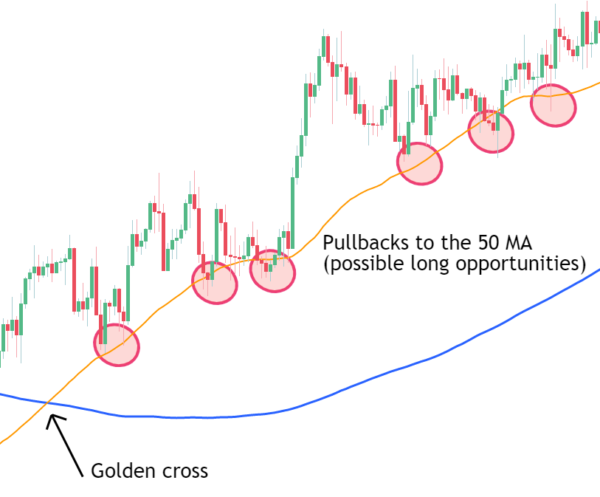
Strategy #2: Entering on pullbacks to the 50 MA
The price always moves in waves.
On an uptrend, the waves to the upside are bigger than the waves to the downside.
We already know that the Golden Cross signals often appear at the tops of those waves.
That’s where newbies will take their trades.
But you want to be a professional, right?
So let’s do it the right way.
After the Golden Cross, wait for the price to come back to the fast moving average.
That’s where it will tend to jump again to the upside.
Should you buy immediately when the price touches the fast moving average?
Well, you can, but…
It’s always better to wait for a bullish reversal pattern to appear.
These are the key locations where you’ll get the best trading opportunities:
The advantages are clear.
You catch the next bullish leg right from the start.
Instead of opening your trade at the top.
Meaning that you may use a tighter stop loss.
And your potential profits will be way bigger too.
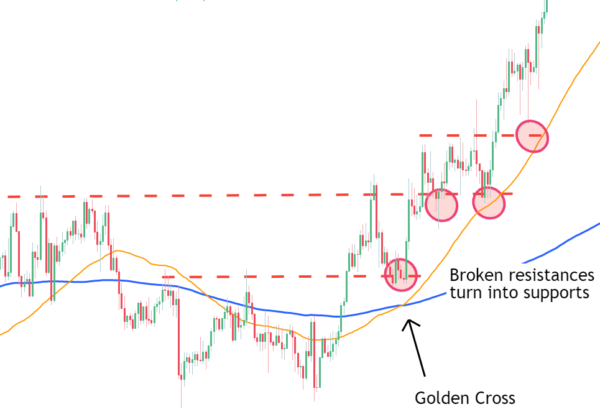
Strategy #3: Price retesting previous resistances that turn into supports
What’s a resistance you ask?
It’s a zone where the price tends to be rejected several times.
But no resistance holds forever.
And when they are broken, the price will often come back down to retest them.
At this time they become supports, throwing the price to the upside again.
So, how do you trade a Golden Cross using supports and resistances?
4 simple steps:
1 – Wait for the Golden Cross with the price above the fast moving average.
2 – Wait for the break of a previous resistance level.
3 – Wait for a pullback and rejection from that resistance that turned into a support level.
4 – Take your trade and aim for higher highs.
Simple right?
Here’s an example with several places where you could take a trade after a Golden Cross chart pattern:
Here’s what you learned today
- The Golden Cross is a bullish market sentiment that occurs after a fast moving average crosses a slow moving average to the upside.
- A Golden Cross chart pattern tends to lag so it’s not necessarily a signal to go long immediately.
- The 5 biggest mistakes trading the Golden Cross chart pattern.
- A Death Cross is the opposite of a Golden Cross, signaling a bearish market sentiment.
- The 3 stages that form a Golden Cross chart pattern.
- How to ride massive trends using Golden Cross and Death Cross chart patterns.
- 3 simple ways of trading the Golden Chart pattern with confidence.
Now I want to hear from you.
How do you trade the Golden Cross chart pattern?
Let me know below in the comments.