
One of the first things that a trader learns is to draw supports and resistances.
But…
That requires chart analysis.
Finding peaks and bottoms.
And it can be subjective depending on who is drawing those levels.
What if you could have automatic support and resistance levels drawn for you?
No work, no subjective analysis.
Sounds good?
These levels are called pivot points.
Let’s dive into them.
Today you’ll learn:
- What are pivot points?
- How many pivot points levels there are
- Types of pivot points
- How to calculate pivot points
- Pivot points indicators
- Best pivot points for intraday trading
- Best pivot points for swing trading
- Pivot points trading strategies
What are pivot points?
Pivot points are used to identify key zones in your charts.
The pivot point itself is the basis of the analysis.
From this pivot point, several lines are drawn.
To the upside, resistances.
To the downside, supports.
Similarly to classic support and resistance, at these levels two things may happen:
- The price experiences a trend change
- The price breaks them indicating a strong market trend
How can we use these levels?
- Set entry points for trades
- Set stop-loss levels
- Set take profit levels
Later in this guide, you’ll learn how to trade those scenarios.
Now you ask…
How many pivot point levels there are?
It depends on what type of pivot points are you using.
For the classic, and most used one, these are the levels:
Resistance levels:
Typically we use three of them.
R1, R2, and R3.
They tend to be a problem to let the price go up when they are hit.
Support levels:
There are also three of these levels.
S1, S2, and S3.
We must be careful with these when the price goes down.
They may tend to block the down move.
Or at least make the price pullback before it keeps going down again.
Pivot point:
This is one single level.
It’s often called PP or P level.
It’s located right in the middle of the resistance and support levels.
When the price is above the pivot point, we consider that the traders are bullish.
If the price is under this level, we consider that the traders are bearish.
This is how they look like:

Types of pivot points
Standard pivot points
These are the most used pivot points.
Also called the Classic of Floor Pivots.
The Floor name comes from the origins of these pivot points.
They were used by floor traders in the futures markets.
To keep them on the right side of the market, they would calculate the resistance and support levels according to the past day’s high, low, and close.
So, they are only good to trade futures?
No!
You can use them on any other market.
Stocks, Forex, or even Cryptos.
Woodie pivot points
Woodie’s pivot points are very similar to the classic ones.
Instead of nine price levels, Woodie’s pivot points give you five price levels.
Another difference is that there’s more weight on the close price than on the high and low prices.
Similar to indices, where some companies have a different weight on the index price.
Or similar to exponential moving averages (EMA), compared to simple moving averages (SMA).
EMAs are calculated to give higher weight to recent prices, while SMAs give the same weight to all prices.
You get the point, right?
Camarilla pivot points
Very similar to the standard pivot points.
Using this method you get four resistance and four support levels.
The theory behind Camarilla’s pivot points is that the price will tend to come to the mean.
Trading them in a simple way, we want to buy at the S3 and S4 levels and sell at the R3 and R4 levels.
Demark pivot points
This is a popular method to calculate pivot points.
But it’s a bit different than all the others.
Why?
Because you only get one support and one resistance.
They are simply used to predict the high and low of the current period.
Fibonacci pivot points
Fibonacci pivot points are calculated using the most popular levels of the Fibonacci indicator.
And which levels you ask?
The 38.2%, 61.8%, and 100%.
After calculating the base pivot point, you use it to get the Fibonacci support and resistance levels.
How to calculate pivot points?
Let’s look at the formulas to calculate the several types of pivot points.
To calculate them you need:
- The High price of the last closed candle
- The Low price of the last closed candle
- The Close price of the last closed candle
For a bearish candle:

For a bullish candle:

What last closed candle you ask?
For daily pivot points, you get the prices from the last daily candle.
For weekly or monthly pivot points, you get the prices from the last weekly or monthly candle.
Simple as that.
Then, just do some simple math.
Here are the formulas.
Standard Pivot Points Calculation
| Pivot Point (PP) | (High + Low + Close) / 3 |
| Resistance (R1) | (2 x PP) – Low |
| Resistance (R2) | PP + (High – Low) |
| Resistance (R3) | High + 2 x (PP – Low) |
| Support (S1) | (2 x PP) – High |
| Support (S2) | PP – (High – Low) |
| Support (S3) | Low – 2 x (High – PP) |
Woodie Pivot Points Calculation
| Pivot Point (PP) | (High + Low + 2 x Close) / 4 |
| Resistance (R1) | (2 x PP) – Low |
| Resistance (R2) | PP + High – Low |
| Support (S1) | (2 x PP) – High |
| Support (S2) | PP – High + Low |
Camarilla Pivot Points Calculation
| Pivot Point (PP) | (High + Close + Low) / 3 |
| Resistance (R1) | Close + (High – Low) x 1.1 / 12 |
| Resistance (R2) | Close + (High – Low) x 1.1 / 6 |
| Resistance (R3) | Close + (High – Low) x 1.1 / 4 |
| Resistance (R4) | Close + (High – Low) x 1.1 / 2 |
| Support (S1) | Close – (High – Low) x 1.1 / 12 |
| Support (S2) | Close – (High – Low) x 1.1 / 6 |
| Support (S3) | Close – (High – Low) x 1.1 / 4 |
| Support (S4) | Close – (High – Low) x 1.1 / 2 |
DeMark Pivot Points Calculation
To get the DeMark pivot levels we first need to calculate a number X.
| If Close > Open | X = 2 x High + Low + Close |
| If Close < Open | X = High + 2 x Low + Close |
| If Close = Open | X = High + Low + 2 x Close |
Now that we have the X number, we can calculate the Pivot Point, Resistance, and Support.
| Pivot Point (PP) | X / 4 |
| Resistance (R1) | X / 2 – Low |
| Support (S1) | X / 2 – High |
Fibonacci Pivot Points Calculation
| Pivot Point (PP) | (High + Low + Close) / 3 |
| Resistance (R1) | PP + (High – Low) x 0.382 |
| Resistance (R2) | PP + (High – Low) x 0.618 |
| Resistance (R3) | PP + (High – Low) |
| Support (S1) | PP – (High – Low) x 0.382 |
| Support (S2) | PP – (High – Low) x 0.618 |
| Support (S3) | PP – (High – Low) |
Pivot points indicators
Tradingview pivot points indicator
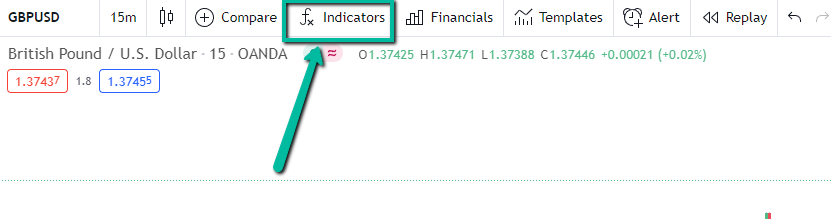
Tradigview has a built-in pivot points indicator.
You just need to click the “Indicators” button in the top toolbar.
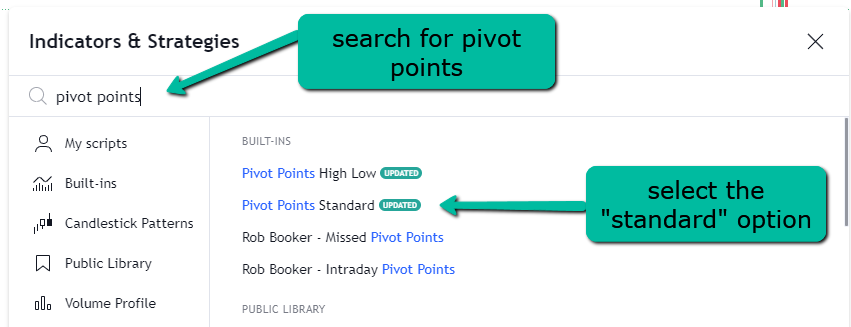
Next, a new window will open.
In the search field just write “pivot points”.
You’ll see several options that match your search terms.
Select the “Pivot Points Standard” from the Built-Ins indicators.
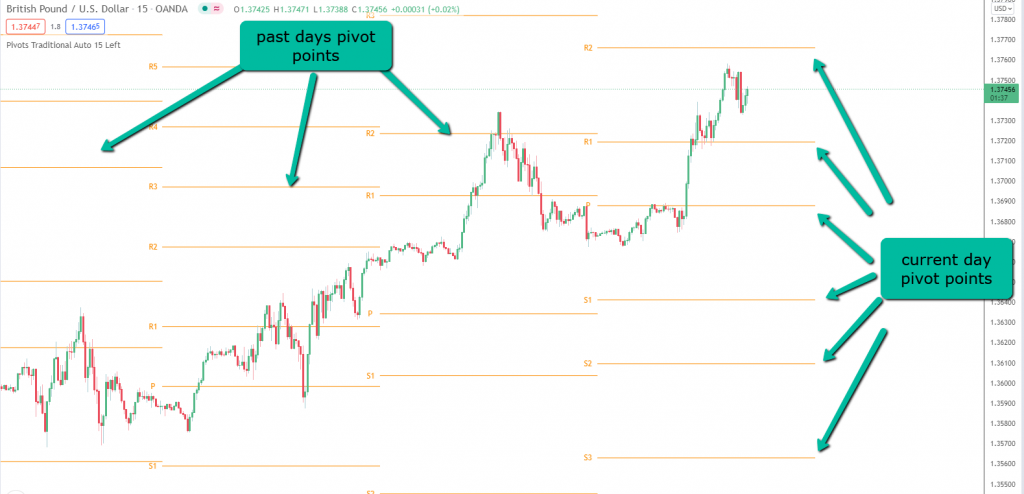
Now you should see several lines on your charts.
Those are the pivot points for each day.
You can see the current pivot points, as well as the past pivot points.
Now you may want to customize your pivot points indicator.
Just click the gear wheel that appears when you hover your mouse in the indicator name (left top corner of the chart).
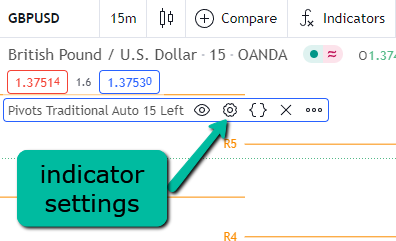
A new window with the settings should appear.
You can enable/disable the ones that you want to see on your charts and change their colors amongst other parameters.
The “Style” and “Visibility” tabs also have more customization options.
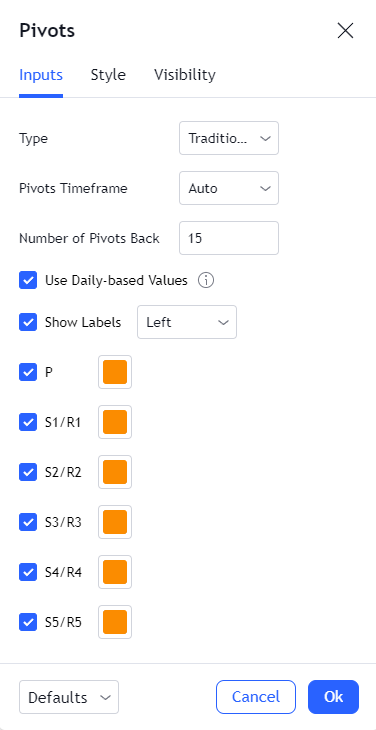
But let’s focus on the inputs tab.
You have two important options here:
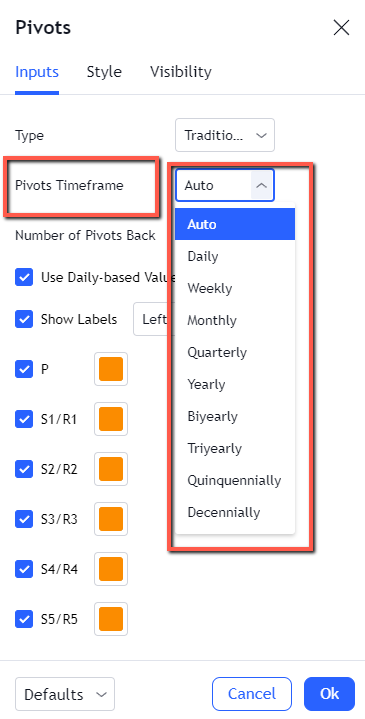
Pivots Time Frame
If you want to use them for intraday you probably want to get them from a daily time frame.
If you want to use them to swing trade, you probably want to switch them to the weekly or monthly time frames.
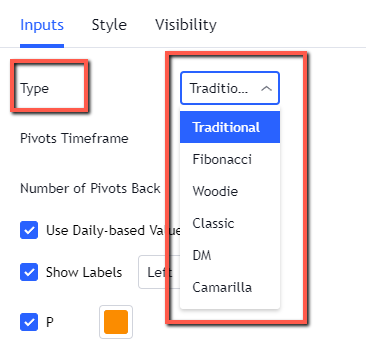
Pivots type
Here you can select the type of calculation that you want to use for your pivot points.
By default, the traditional is selected, but you may want to change to any other type: Fibonacci, Woodie, Classic, DM, or Camarilla.
And that’s it!
Simple right?
Which pivot points are the best for intraday trading?
When day trading, you want to open and close your trades within the same day.
For that reason, the daily pivot points are the most commonly used.
Why?
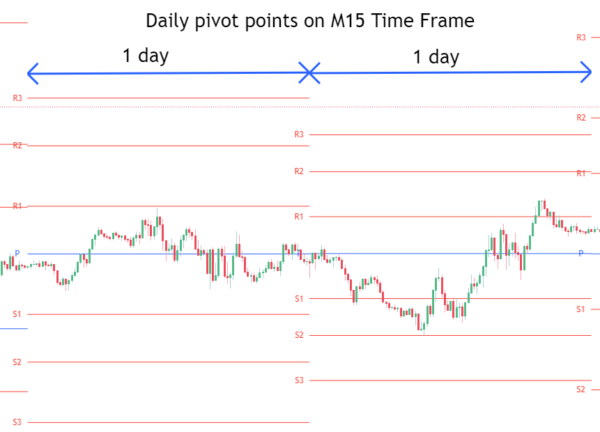
Because you want to know what are the supports and resistances where the price may tend to face while moving during the current day.
Look at this example.
M15 time frame.
Using daily pivot points, we have new levels every day:
Which pivot points are the best for swing trading?
Swing trading involves opening and closing trades within several days.
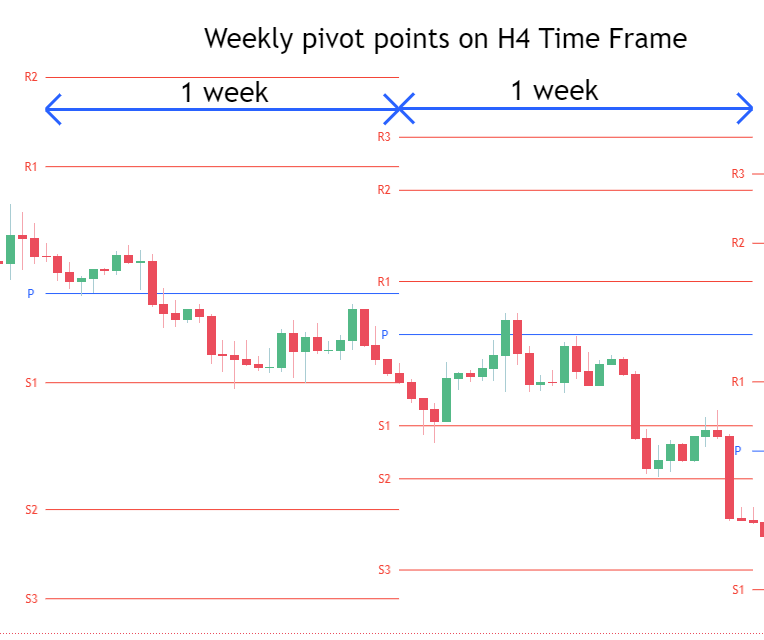
If you swing trade you may want to use the weekly pivot points.
What do you get from them?
Supports and resistances that the price may experience during the whole week.
Much better, right?
Using weekly pivot points, we have new levels every new week:
But that’s not all.
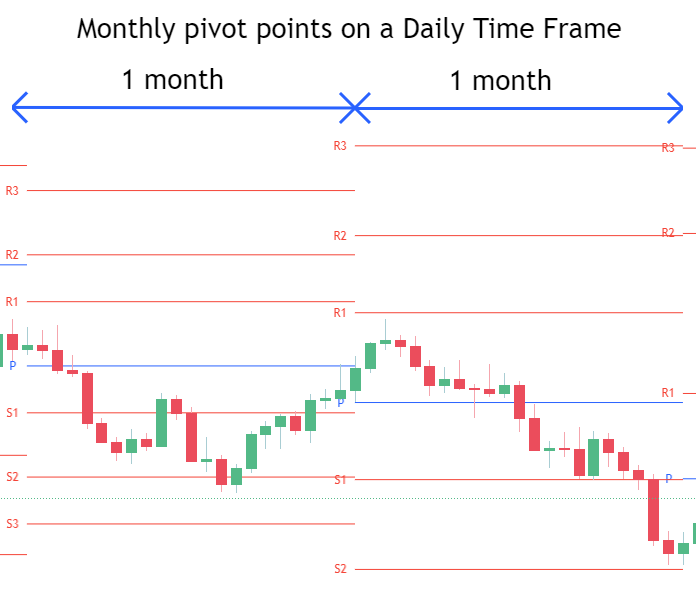
Holding your trades for more than a single week?
You may want to check the monthly pivot points.
You’ll know what price levels may mess with your trades during a whole month.
As you can see, you only get new pivot point levels every new month:
Pivot point trading strategies
Using pivot points to get the market sentiment
One way to use pivot points is to measure the market sentiment.
The market sentiment is nothing more than identifying if the market is bearish or bullish.
And how do we do it?
We use the Pivot Point (PP).
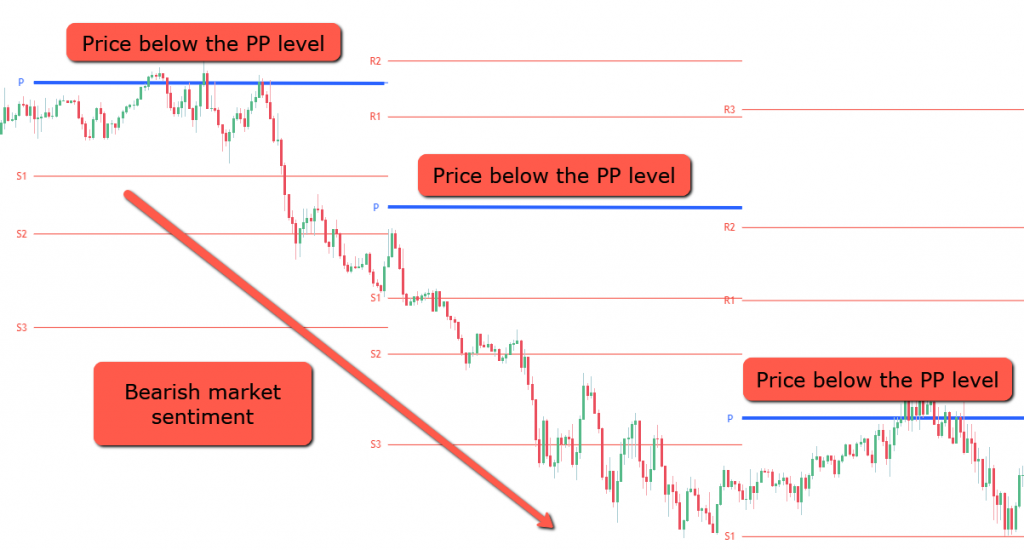
- When the price is above the Pivot Point, the market is considered bullish.
- If the price is below the Pivot Point, the market is considered bearish.
Check this real example of bearish market sentiment:
Filtering trades following the trend direction
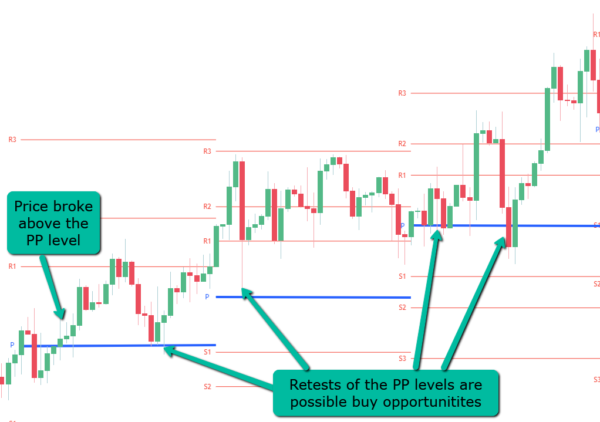
When a market is trending, the Pivot Point (PP) levels are good places to wait for buying opportunities.
Sure that we can use other levels to take our trades.
But the thing is…
The further away the price is from the mean point (PP), the higher the chances that it will come back to meet it again.
What does this mean?
The PP levels are great places to catch trades with a decent risk/reward when a market is trending.
You have two options to enter your trades.
Aggressive way: Open your trade when the market touches the level.
Conservative way: Wait for a price action rejection like engulfing candles, or pinbars.
Using Pivot Points as a trailing stop to ride long-term trends
Pivot points can be used to squeeze the most out of a trade.
How?
Using them as a trailing stop.
Let’s say you are shorting the market.
You can place your Stop Loss at the resistance (R1) above the Pivot Point.
While the price keeps moving under the R1 resistance, you let your trade open.
When the price breaks R1, you close the trade.
Like this:
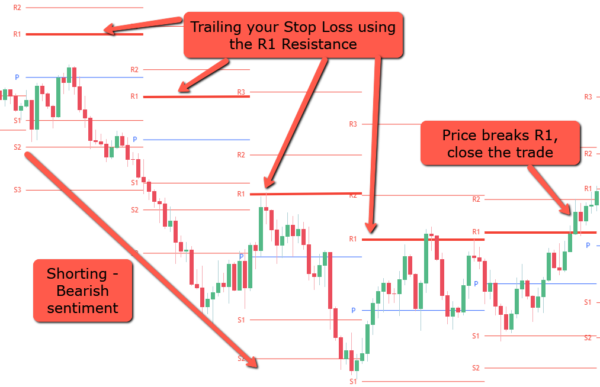
Pro tip
For more volatile markets you can use resistance R2 or even R3. This will let the price breathe and potentially ride the trend for a longer term.
Using Pivot Points as a trailing stop to ride intraday trends
Do you know those days when the price just doesn’t stop going up?
A lot of volume and momentum will tend to create a strong trend during the day.
On these kinds of days, we can take advantage of that.
We can use our Pivot Point levels to trail our stop loss.
Squeezing the most out of the trend.
Much better than having fixed targets.
And how do we do that?
Simple.
Just adjust your stop loss to the previous pivot level, when the price breaks the next one.
Like this:
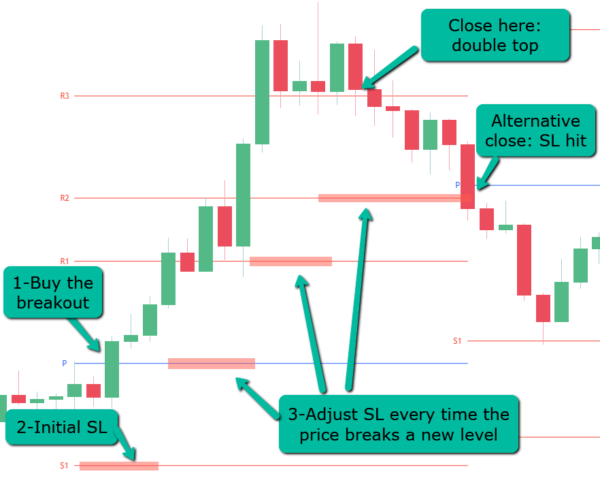
Then you have two options to close.
- You let it hit your Stop Loss.
- You close the trade when you see some price action that will indicate a possible end of a trend, like a double top or head and shoulders pattern.
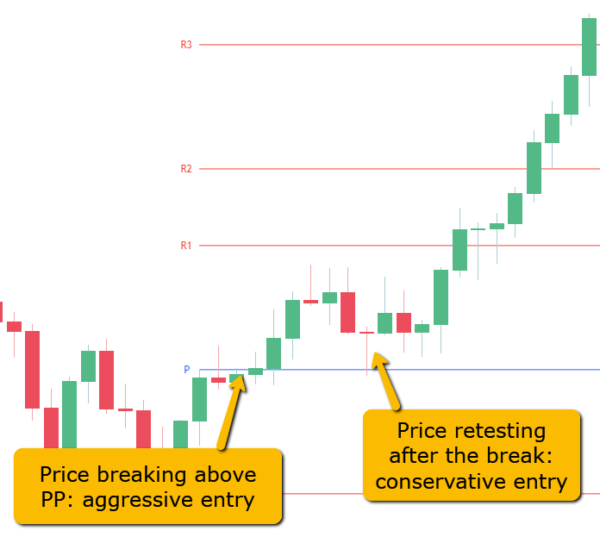
Pivot point breakout strategy
Have you ever thrown a stone through a window?
I hope not…
But you know what happens.
The glass will probably break and the stone will keep going.
When a level is broken, it’s the same thing.
The price has a higher chance to keep moving in that direction.
That’s when you have a chance to trigger your breakout trade.
If you are a conservative trader, you wait for the price to break and retest the level to enter.
If you are an aggressive trader, you can open your trade as soon as the price hits the level.
This works better when the price is on a strong fast trend.
Check this example:
Pro tip
You can trade the breakout of any level. Just keep in mind that the further away from the Pivot Point, the more likely will be for the price to come back again.
Let’s say you are a conservative trader.
You had one chance to enter your trade when the Pivot Point (PP) level was broken and retested.
As an aggressive trader, you could open trades every time that the price broke a new resistance level.
So, which way is best?
As an aggressive trader, you’ll get more stops, but more trading opportunities and potentially bigger rewards.
As a conservative trader, you’ll get fewer stops, but also fewer trades and potentially smaller rewards.
At the end of the day is up to you.
What matters is consistency.
Just choose your trading style according to your personality and keep doing the same thing.
That’s how you get an equilibrium between profits and losses.
Be consistent with your actions.
Pivot point range trading strategy
Imagine a tennis ball going from one player to the other.
And this repeats several times.
Until one of them misses and the ball keeps going.
Trading ranges using pivot points is like playing tennis.
The price will tend to react to the levels and go back to the previous level.
Aggressive traders will play them when the price touches a pivot point.
Conservative traders will wait for a reversal pattern to enter their trades.
Look at this example.
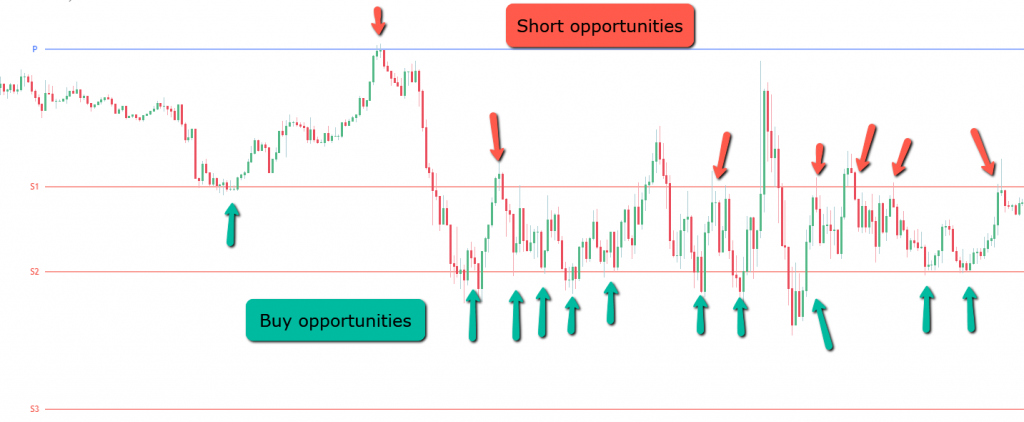
Pro tip
Trading ranges are especially good when there’s low volume making the price move sideways.
Final Thoughts
Pivot Points are a great tool to draw automatic support and resistance levels.
Those levels come from simple math calculations.
Once you are comfortable with their meaning and how the price reacts to them you can increase the accuracy of your trades.
The best results come when you combine them with other technical indicators like moving averages or any other that you like to use.
Quick Recap:
This is what you learned today:
- Pivot points are used to draw automatic support and resistance levels
- They can be used to set stop losses and targets for your trades
- For day trading the daily pivots are more popular
- For swing trading, weekly and monthly pivots are the best option
- You can use them to trade different markets structures: price trending or ranging
- They are useful to understand the current market trend and filter your trades
Now I want to hear from you…
Do you trade Pivot Points?
What’s your favorite way of trading Pivot Points and which indicators do you combine with them?
Let me know below in the comments!