
Everything that you need to know about the Shooting Star candlestick pattern is here.
Today you’ll learn:
- What Is The Shooting Star Candlestick Pattern
- How To Identify The Shooting Star Candlestick Pattern
- Variants of the Shooting Star Candlestick Pattern
- How To Trade The Shooting Star Candlestick Pattern
- Strategies To Trade The Shooting Star Candlestick Pattern
- Strategy 1: Pullbacks On Naked Charts
- Strategy 2: Trading The Shooting Star With Resistance Levels
- Strategy 3: Trading The Shooting Star With Moving Averages
- Strategy 4: Trading The Shooting Star With RSI Divergences
- Strategy 5: Trading The Shooting Star With Fibonacci
- Strategy 6: Trading The Shooting Star With Pivot Points
- What Is The Success Rate Of The Shooting Star?
- This is what you learned today
- Learn More
What Is The Shooting Star Candlestick Pattern
The Shooting Star is a Japanese candlestick pattern.
It’s a bearish reversal pattern.
Usually, it appears after a price move to the upside and shows rejection from higher prices.
The pattern is bearish because we expect to have a bear move after a Shooting Star appears at the right location.
It’s a reversal pattern because before the Shooting Star appears we want to see the price going up, thus it’s also a frequent signal of the end of a trend.
The Shooting Star pattern is also a mirrored version of the Hanging Man candlestick pattern.
How To Identify The Shooting Star Candlestick Pattern
The Shooting Star candlestick pattern is formed by one single candle.
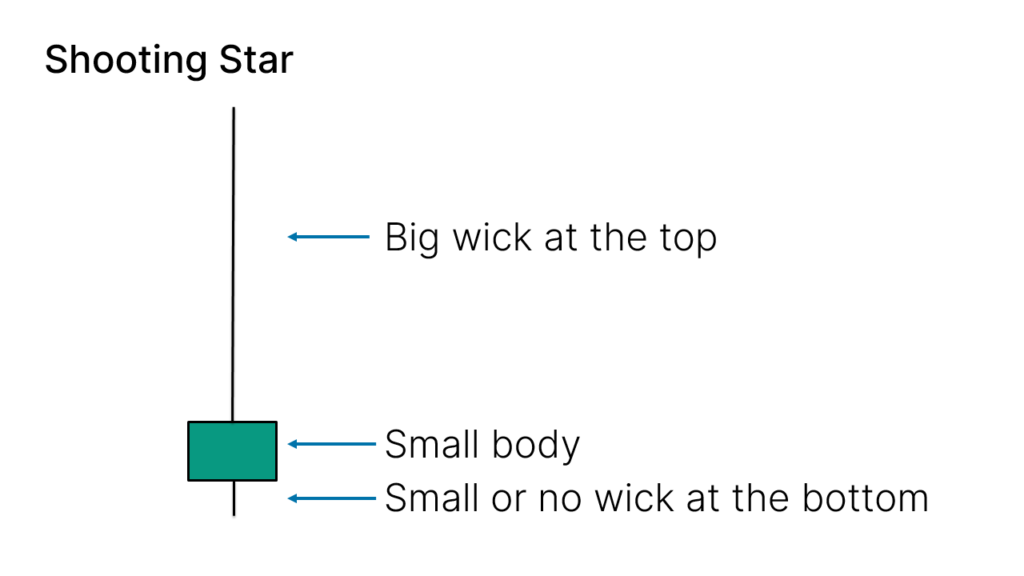
Here’s how to identify the Shooting Star candlestick pattern:
- The candle has a small body
- The wick at the top must be big compared to the body
- At the bottom, it should have no wick, or be very small
- The color of the body doesn’t matter
It looks like this on your charts:
Variants of the Shooting Star Candlestick Pattern
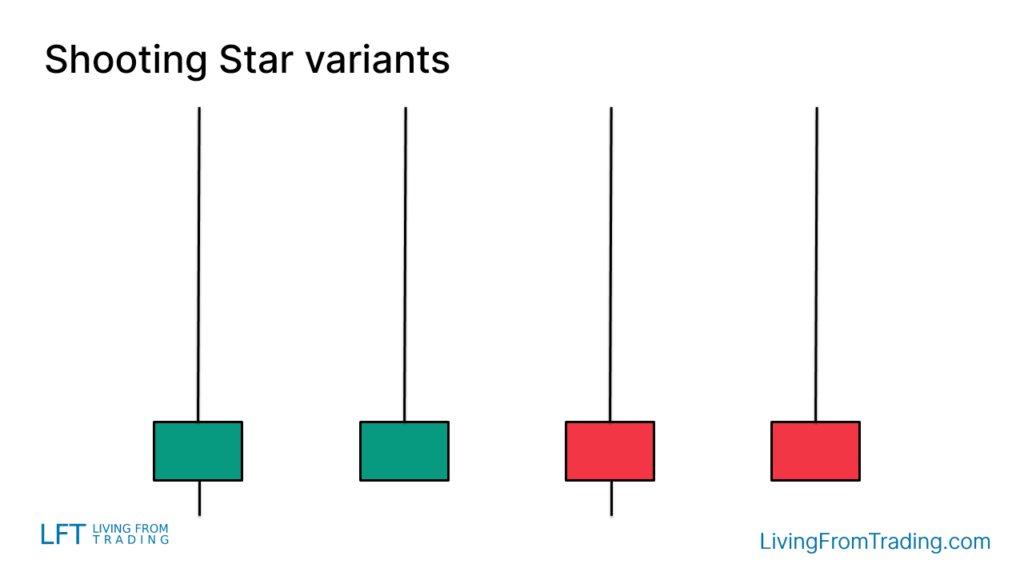
The Shooting Star candlestick pattern may appear a little different on your charts.
The color of the body doesn’t matter, it can be either red or green (bearish or bullish).
The existence or not of a wick (shadow) at the bottom doesn’t matter too. As long as it’s small you’re good to go.
Here’s what it may look like on your charts:
How To Trade The Shooting Star Candlestick Pattern
To trade the Shooting Star candlestick pattern it’s not enough to simply find a candle with the same shape on your charts.
In fact, there are other candlestick patterns that have the exact same shape, like the Inverted Hammer candlestick pattern.
Confused?
Let me explain.
What makes a pattern valid is not just the shape, but also the location where it appears.
This means that the same shape appearing at different locations may have different meanings.
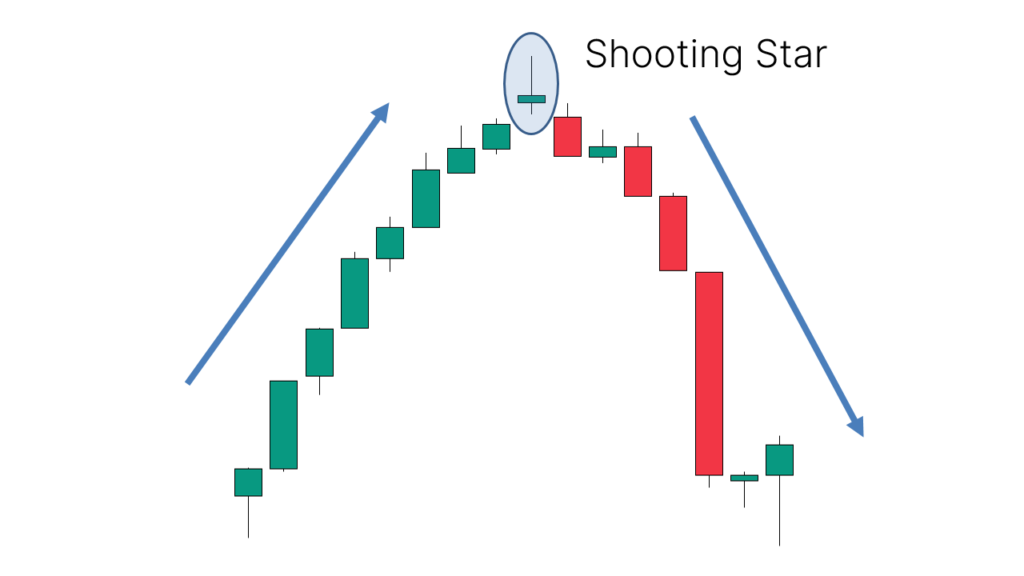
When trading the Shooting Star, we want to see the price first going up, making a bullish move.
A Shooting Star appearing after this bullish move is a sign of a possible reversal to the downside.
It looks like this:
Now you’re thinking.
“When do I open my trade?”
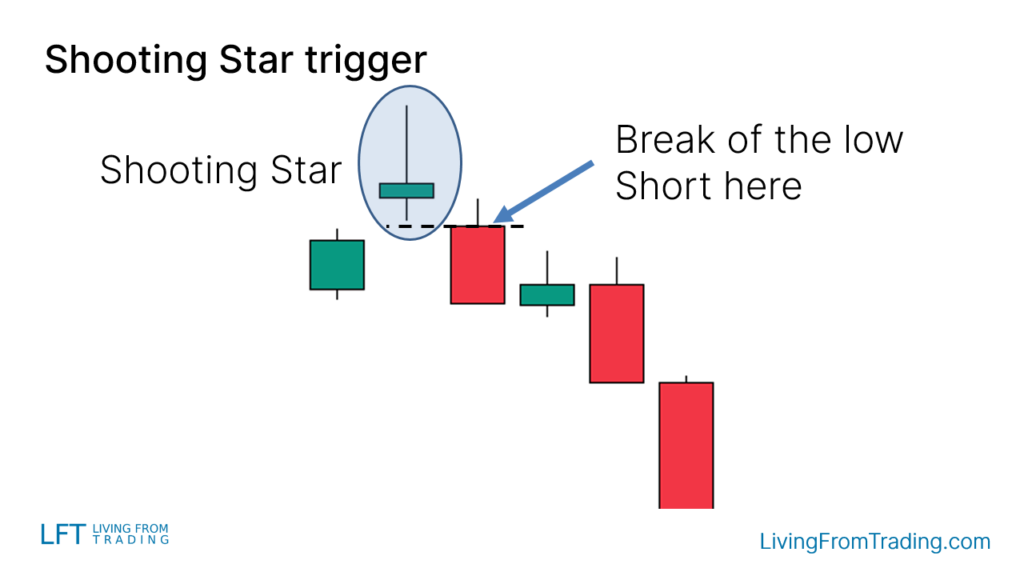
It’s simple, the Shooting Star pattern is traded when the low of the candle is broken.
That’s your conservative trigger to short.
It looks like this:
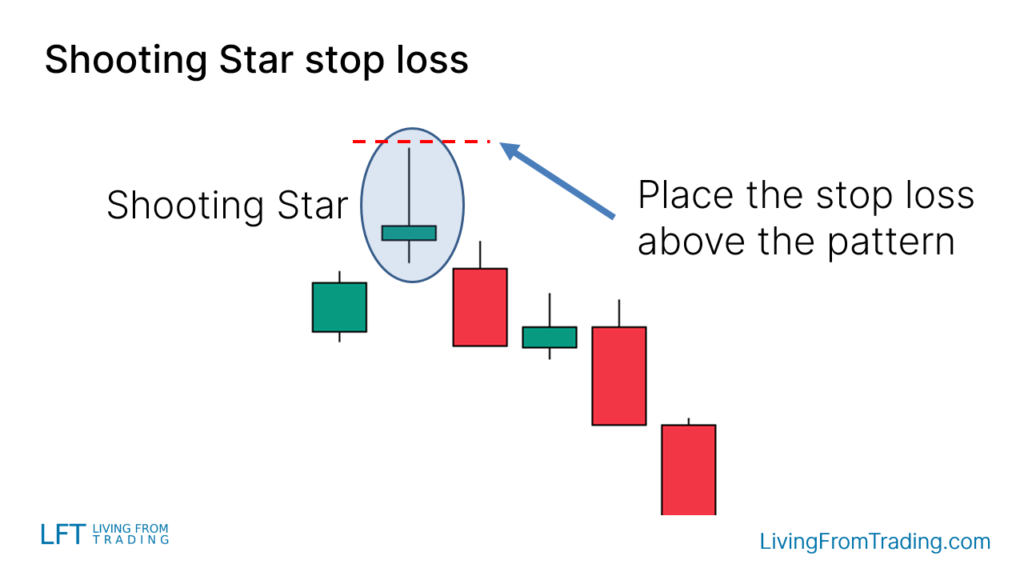
Now, you also want to protect yourself because when trading things don’t always move as we expect.
And for that, we use a stop loss.
There are several different types of stop losses.
The most common is to use the other side of the pattern to set it.
But wait, don’t jump into trading the Shooting Star right yet.
There are a few more things to know.
Ideally, to increase the accuracy, we want to trade the Shooting Star candlestick pattern by combining it with other types of technical analysis or indicators.
Here are a few strategies to trade the Shooting Star pattern.
Strategies To Trade The Shooting Star Candlestick Pattern
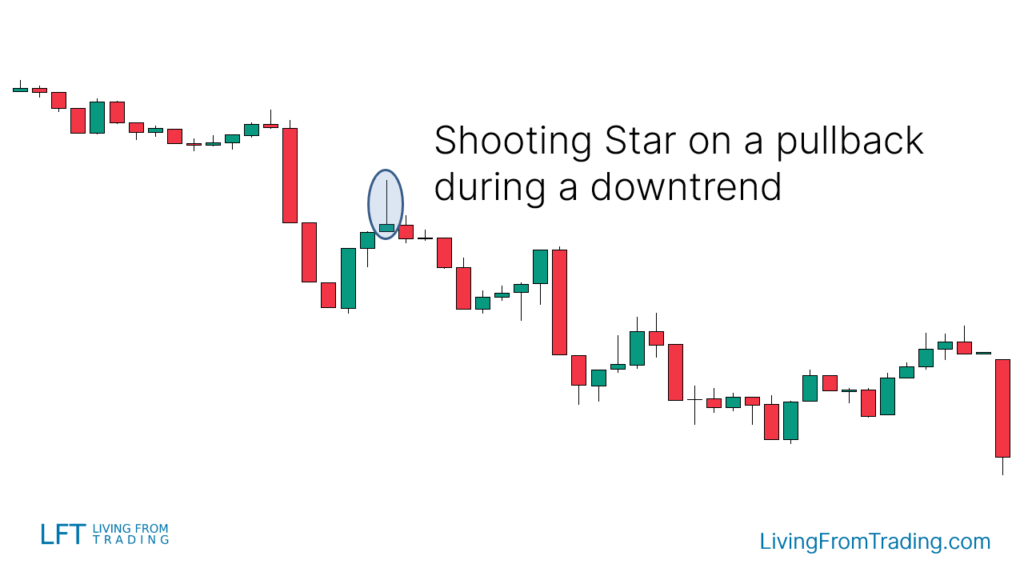
Strategy 1: Pullbacks On Naked Charts
As a bearish reversal pattern, the Shooting Star is a great pattern to watch for when the price is on a downtrend.
Just wait for a pullback to start, and then spot when the Shooting Star appears.
That often signs the end of the pullback and the start of the new leg to the downside.
Here’s an example:
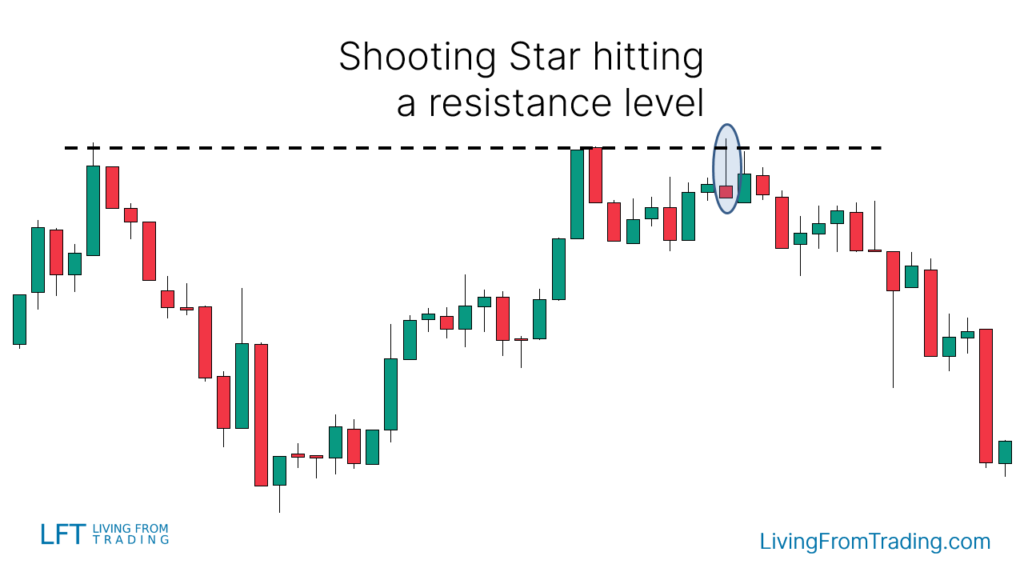
Strategy 2: Trading The Shooting Star With Resistance Levels
Support and resistance levels are great places to find price reversals.
Since we are looking for moves to the downside, we want to trade the Shooting Star using resistance levels.
How does it work:
- Draw resistance levels on your charts
- Wait for the price to go up and hit the resistance level
- Check if a Shooting Star appears at that level
- Short when the price breaks the low of the Shooting Star
- Set your stop loss and take profit levels, and expect a move to the downside
Here’s an example:
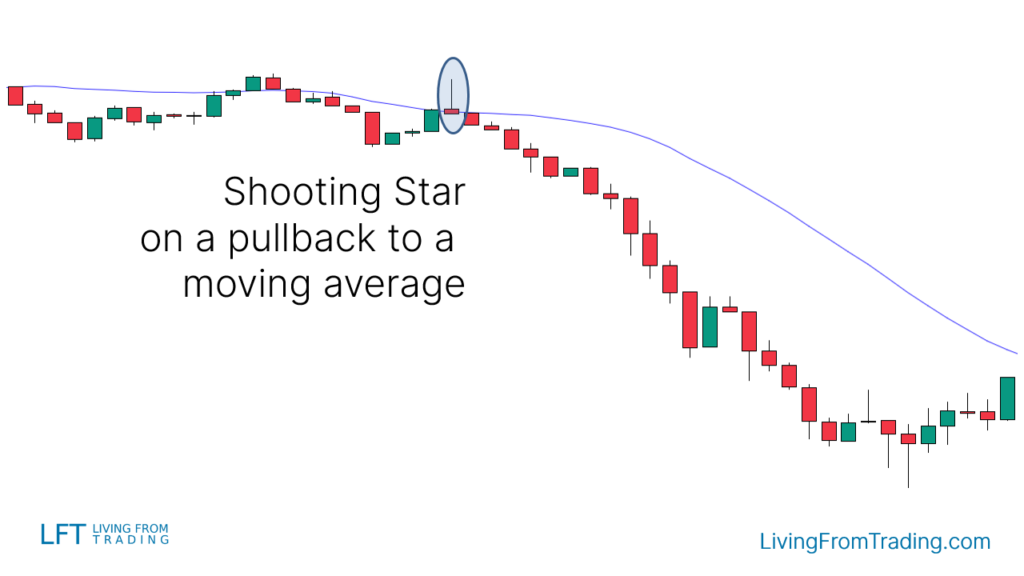
Strategy 3: Trading The Shooting Star With Moving Averages
Moving averages are great trading indicators to trade trends.
The idea here is to trade pullbacks to the moving average when the price is on a downtrend.
How does it work:
- Find a downtrend, with the price jumping below a moving average
- Wait for the price to go up and hit the moving average
- Check if a Shooting Star appears at the moving average
- Short when the price breaks the low of the Shooting Star
- Set your stop loss and take profit levels, and expect another leg to the downside
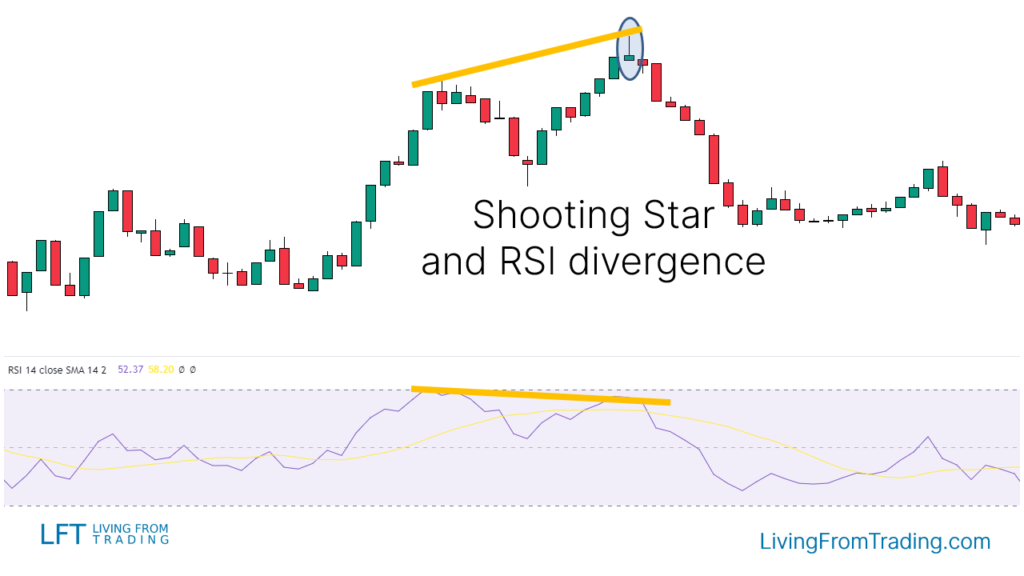
Strategy 4: Trading The Shooting Star With RSI Divergences
This is a bit different from the other trading strategies.
To find a bearish RSI Divergence we want to see the price on an uptrend first, making higher highs and higher lows.
Here’s how it works:
- Find an uptrend
- Mark the highs that the price makes after each leg to the upside
- At the same time compare the price highs with the RSI indicator
- When you see the RSI making lower highs while the price making higher highs, you found your divergence
- Now you wait until a Shooting Star appears at a price higher high, aligned with an RSI lower high.
- Short when the price breaks the low of the Shooting Star
- Set your stop loss and take profit levels, and expect a move to the downside.
It looks like this:
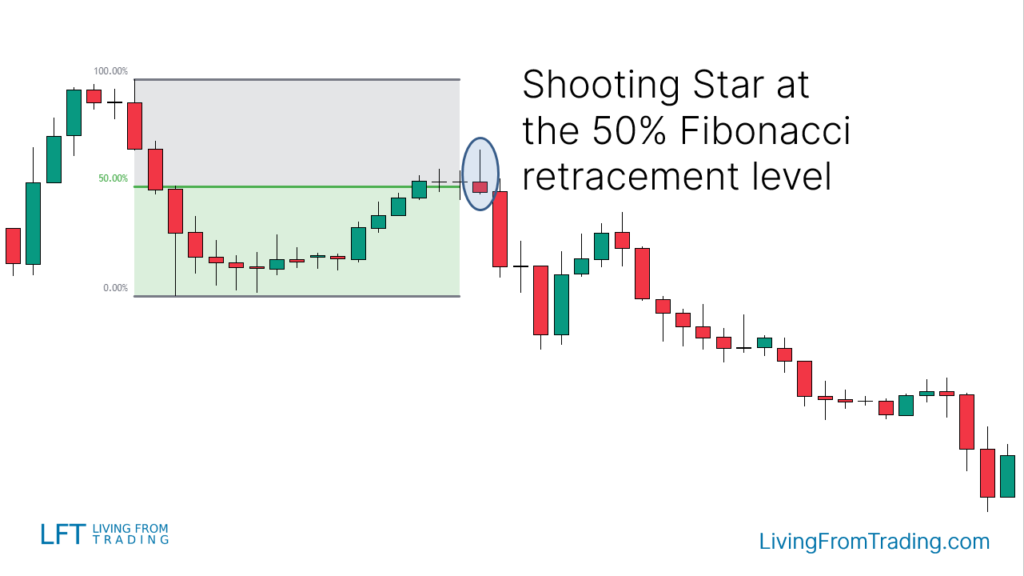
Strategy 5: Trading The Shooting Star With Fibonacci
Another popular way of trading the Shooting Star candlestick is using the Fibonacci retracement tool.
Fibonacci shows retracement levels where the price will tend to revert frequently.
Depending on the strength of the trend, different levels are more likely to work better with the Shooting Star pattern. Here you can learn more about the different Fibonacci retracement levels.
Here’s how the strategy works:
- You want to see the price on a downtrend, or at the start of a new one
- Then you wait for a move to the upside, they always happen at some point
- Pick your Fibonacci tool and draw the levels from the high to the low of the move
- When the price hits a Fibonacci level and prints a Shooting Star, that’s what you are waiting for
- Short when the price breaks the low of the Shooting Star
- Set your stop loss and take profit levels, and expect a move to the downside
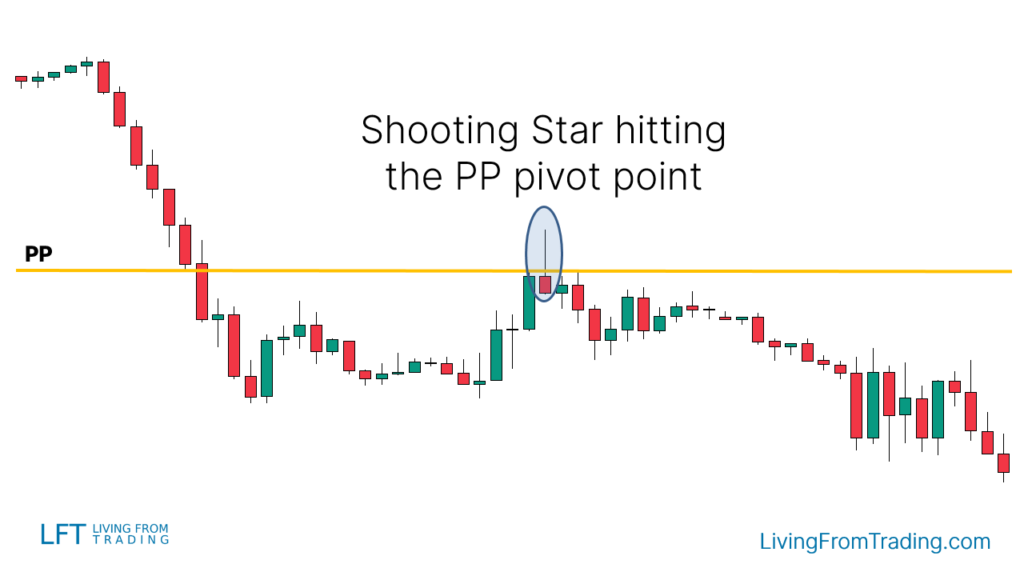
Strategy 6: Trading The Shooting Star With Pivot Points
Pivot Points are automatic support and resistance levels calculated using math formulas.
If you are day trading, the Daily Pivot Points are the most popular, although the Weekly and Monthly are frequently used too.
Here’s how to trade the Shooting Star pattern with Pivot Points:
- Activate the Pivot Points indicator on your charts
- Check which Pivot Points are above the price, those will tend to work as a resistances
- Ideally, you want to see the price on a downtrend, although it’s not required
- Wait for a price move to the upside to a Pivot Point level
- At that level, you want to see a Shooting Star pattern appearing, meaning that the level is being rejected
- Short when the price breaks the low of the Shooting Star
- Set your stop loss and take profit levels, and expect a move to the downside
What Is The Success Rate Of The Shooting Star?
According to the Encyclopedia of Candlestick Charts by Thomas N. Bulkowski (link), the Shooting Star candlestick pattern has a success rate of 60%.
This is what you learned today
- The Shooting Star is a single-candle pattern.
- To be valid, it must appear after a move to the upside.
- It’s a bearish reversal pattern, meaning that it signs a potential reversal to the downside.
- To increase the accuracy, you can trade the Shooting Star using pullbacks, moving averages, and other trading indicators.
- The winning rate of the Shooting Star pattern is 60%.
Now I want to hear from you.
Do you trade the Shooting Star candlestick pattern?
Let me know in the comments below.
Learn More
- List of all candlestick patterns explained