
Everything that you need to know about the Mat Hold candlestick pattern is here.
Today you’ll learn:
- What Is The Mat Hold Candlestick Pattern
- How To Identify The Bullish Mat Hold Candlestick Pattern
- How To Identify The Bearish Mat Hold Candlestick Pattern
- How To Trade The Bullish Mat Hold Candlestick Pattern
- How To Trade The Bearish Mat Hold Candlestick Pattern
- Strategies To Trade Mat Hold Candlestick Pattern
- Strategy 1: Pullbacks On Naked Charts
- Strategy 2: Trading The Mat Hold With Support And Resistance Levels
- Strategy 3: Trading The Mat Hold With Moving Averages
- Strategy 4: Trading The Mat Hold With RSI Divergences
- Strategy 5: Trading The Mat Hold With Fibonacci
- Strategy 6: Trading The Mat Hold With Pivot Points
- What Is The Success Rate Of The Mat Hold?
- This is what you learned today
- Learn More
What Is The Mat Hold Candlestick Pattern
The Mat Hold is a Japanese candlestick pattern.
It’s a continuation pattern and it has a bullish and bearish version.
The bullish Mat Hold appears as a pause after a price move to the upside and shows rejection from lower prices, thus it’s also a frequent signal of a trend continuation.
The bearish is the opposite, appears after a price decline, and shows rejection from higher prices, suggesting a continuation of the bearish move.
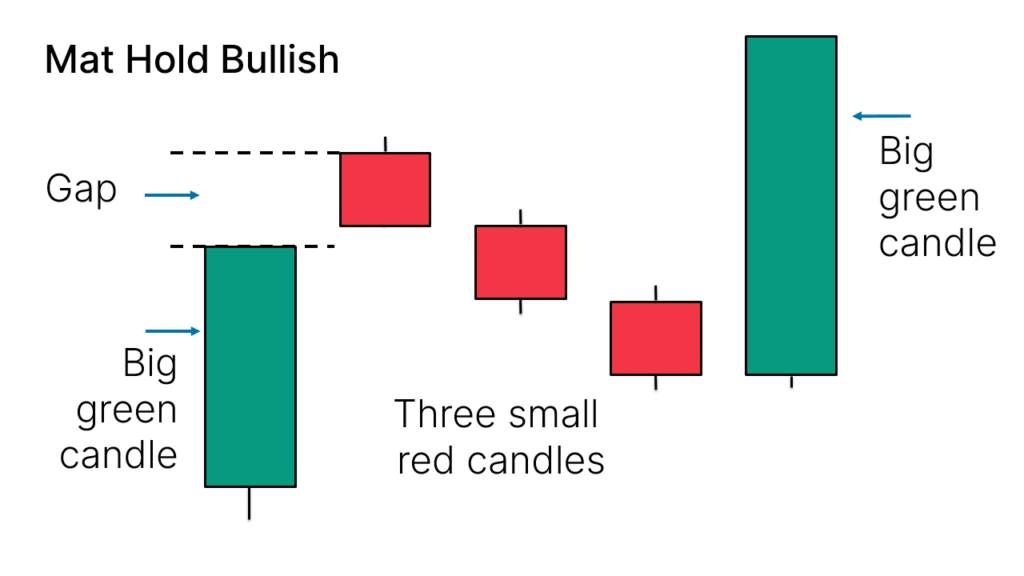
How To Identify The Bullish Mat Hold Candlestick Pattern
The bullish Mat Hold candlestick pattern is formed by five candles.
Here’s how to identify the bullish Mat Hold candlestick pattern:
- Initially, you want to see a big green candle
- Followed by a gap and three small red candles
- The red candles don’t break the low of the first green candle
- Finally, another big green candle, closing above the other candles
It looks like this on your charts:
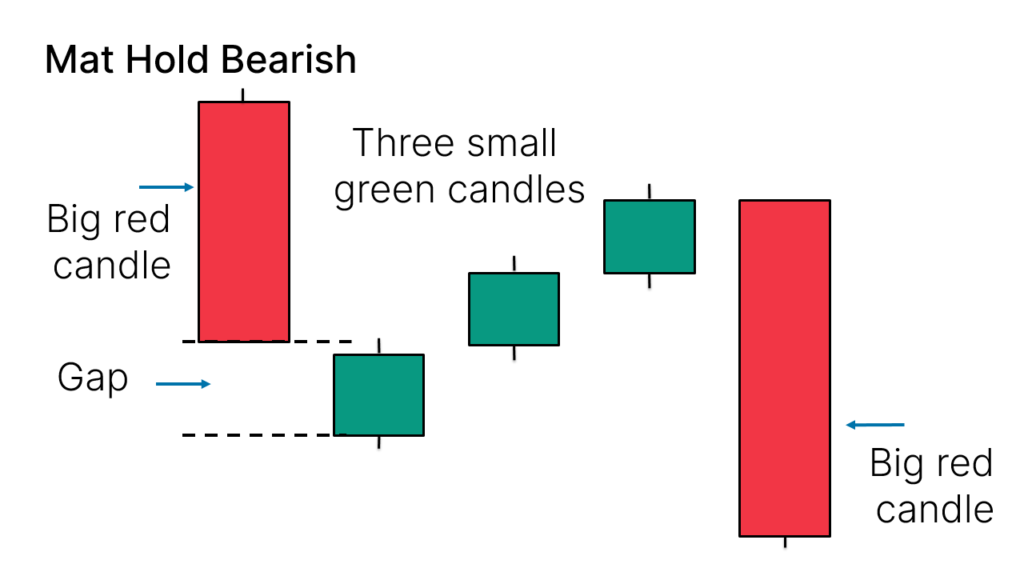
How To Identify The Bearish Mat Hold Candlestick Pattern
The bearish Mat Hold candlestick pattern is formed by five candles.
Here’s how to identify the bearish Mat Hold candlestick pattern:
- Initially, you want to see a big red candle
- Followed by a gap and three small green candles
- The green candles don’t break the high of the first red candle
- Finally, another big red candle, closing below the other candles
It looks like this on your charts:
How To Trade The Bullish Mat Hold Candlestick Pattern
To trade the Mat Hold candlestick pattern it’s not enough to simply find a series of candles with the same shape on your charts.
Let me explain.
What makes a pattern valid is not just the shape, but also the location where it appears.
This means that the same shape appearing at different locations may have different meanings.
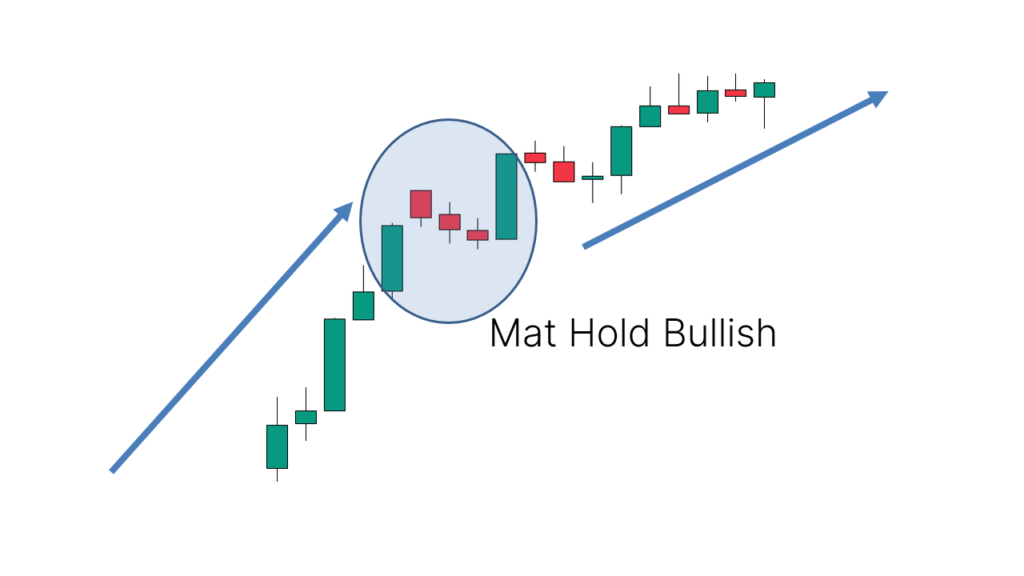
When trading the bullish Mat Hold, we want to see the price first going up, making a bullish move.
A Mat Hold appearing after this bullish move is a sign of a possible trend continuation to the upside.
It looks like this:
Now you’re thinking.
“When do I open my trade?”
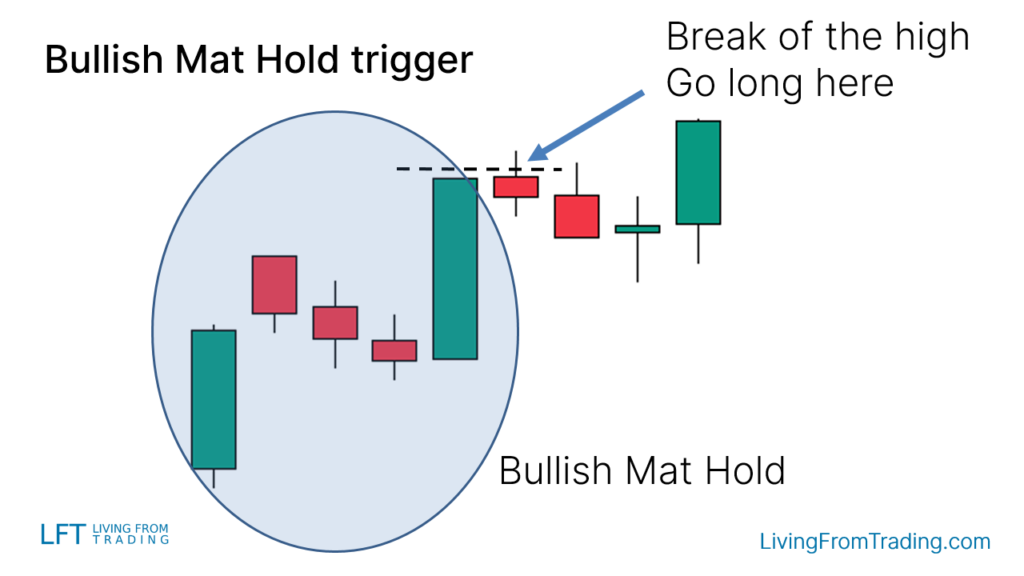
It’s simple, the bullish Mat Hold pattern is traded when the high of the last candle is broken.
That’s your conservative trigger to go long.
It looks like this:
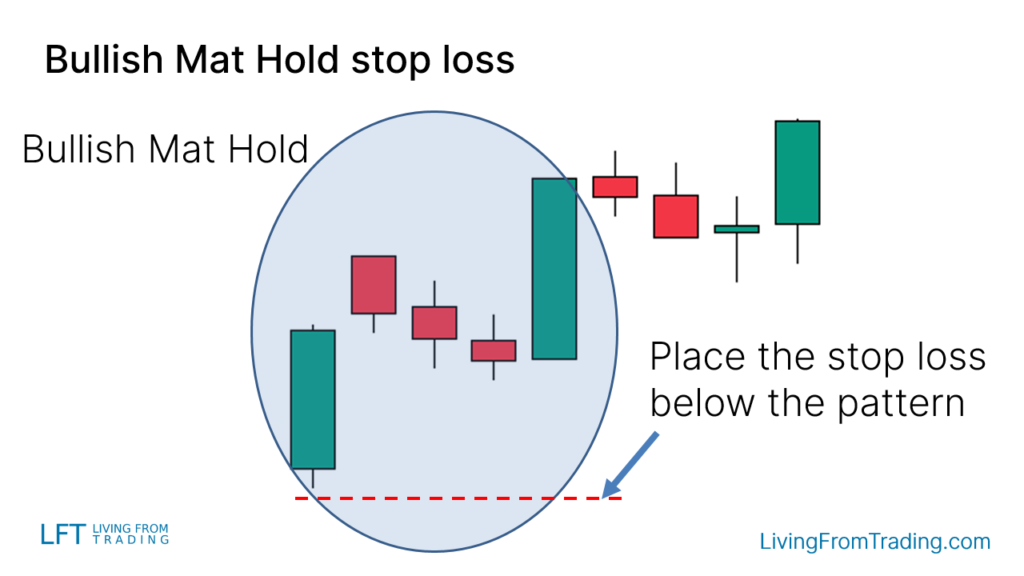
Now, you also want to protect yourself because when trading things don’t always move as we expect.
And for that, we use a stop loss.
There are several different types of stop losses.
The most common is to use the other side of the pattern to set it.
Like this:
How To Trade The Bearish Mat Hold Candlestick Pattern
To trade the bearish Mat Hold candlestick pattern we just mirror what we do when trading the bullish version.
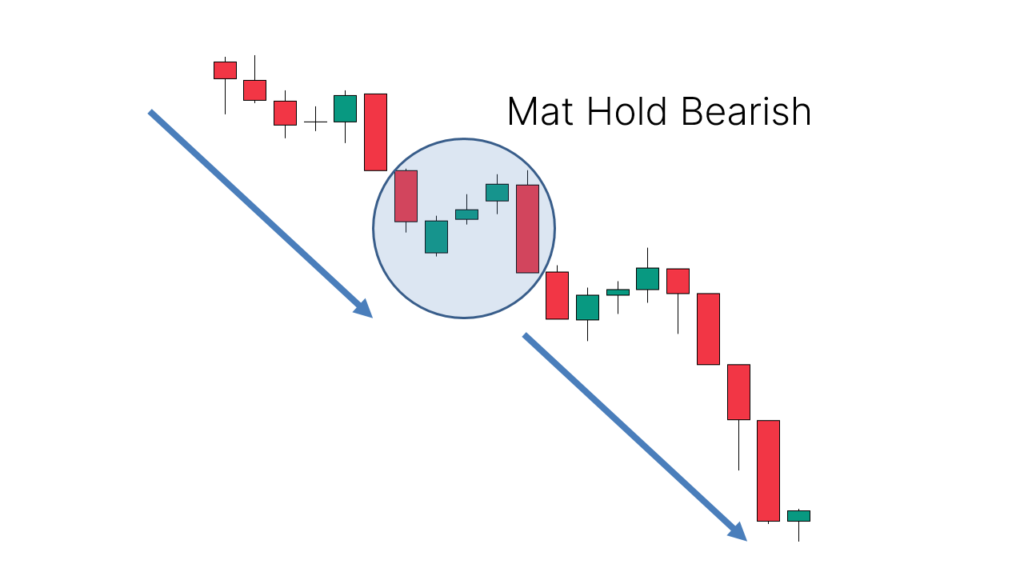
When trading the bearish Mat Hold, we want to see the price first going down, making a bearish move.
A bearish Mat Hold appearing after this bearish move is a sign of a possible trend continuation to the downside.
It looks like this:
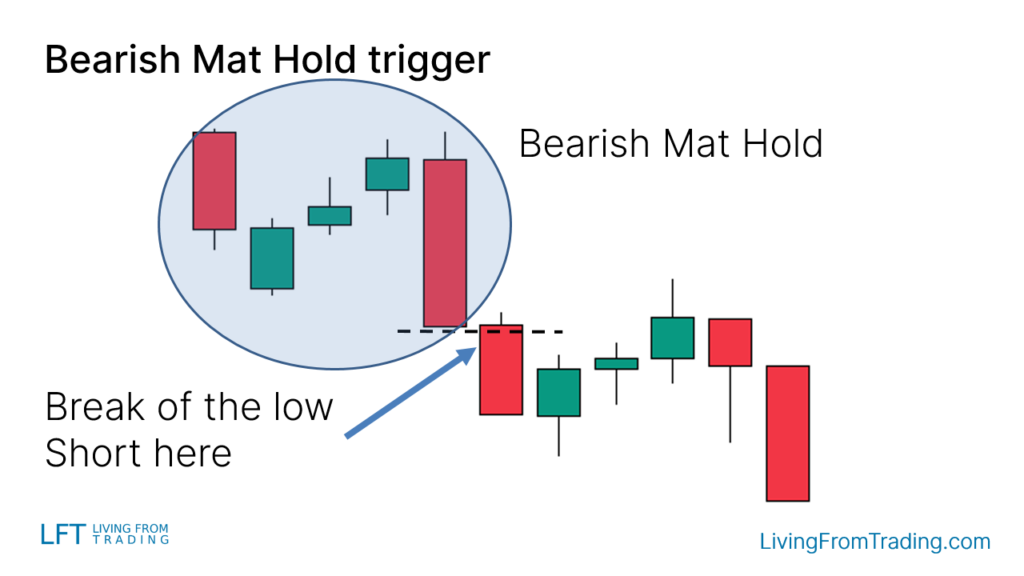
Now let’s talk about opening trades.
It’s simple, the bearish Mat Hold pattern is traded when the low of the last candle is broken.
That’s your conservative trigger to short.
It looks like this:
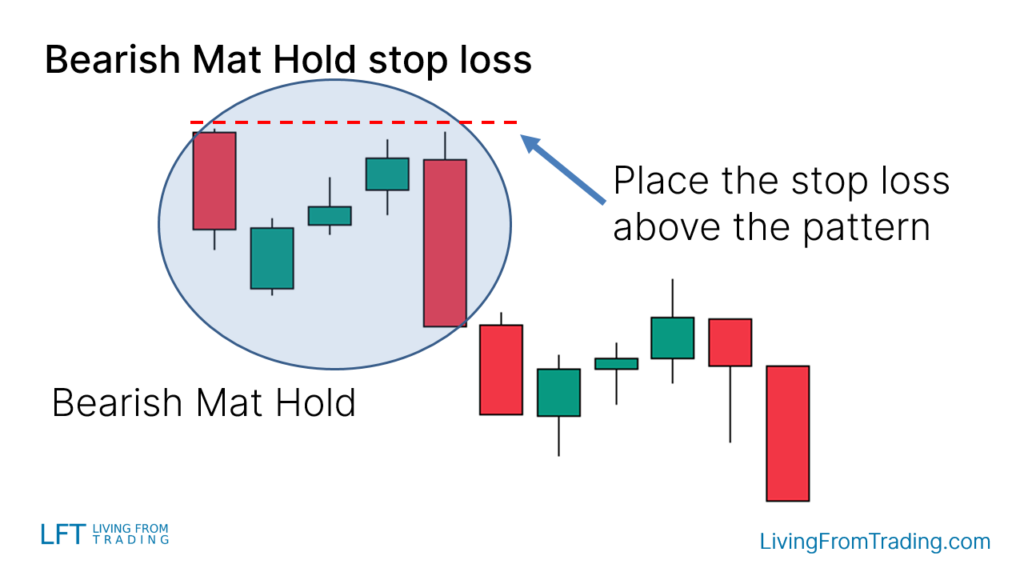
Now let’s protect ourselves.
The most common way to set the stop loss is to use the other side of the pattern.
Like this:
But wait, don’t jump into trading the Mat Hold right yet.
There are a few more things to know.
Ideally, to increase the accuracy, we want to trade the Mat Hold candlestick pattern by combining it with other types of technical analysis or indicators.
Here are a few strategies to trade the Mat Hold pattern.
Strategies To Trade The Mat Hold Candlestick Pattern
Strategy 1: Pullbacks On Naked Charts
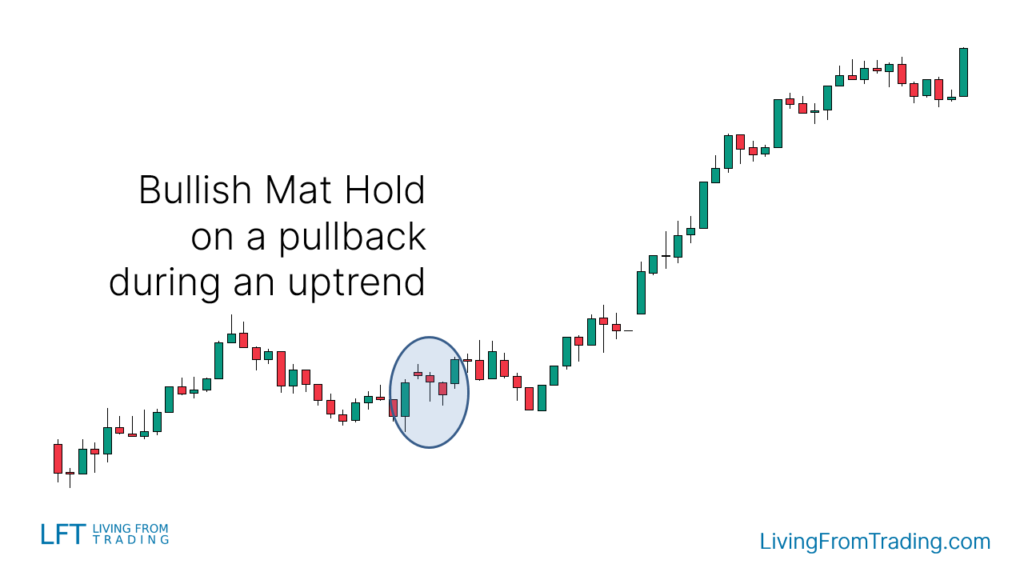
As a continuation pattern, the Mat Hold is a great pattern to watch for when the price is trending.
Just wait for a pullback to start, and then spot when the Mat Hold appears.
That often signs the end of the pullback and the start of the new leg in the trend direction.
Here’s an example of an uptrend:
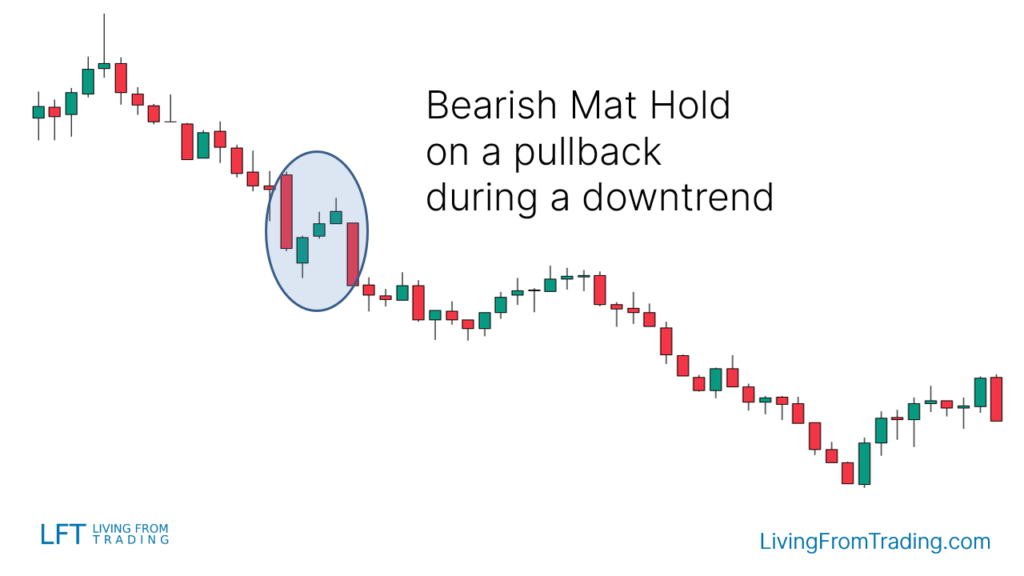
And here we can see the Bearish Mat Hold during a downtrend:
Strategy 2: Trading The Mat Hold With Support and Resistance Levels
Support and resistance levels are great places to find entries.
Since we are looking for continuation moves, we want to trade the Mat Hold using support and resistance levels broken and then retested.
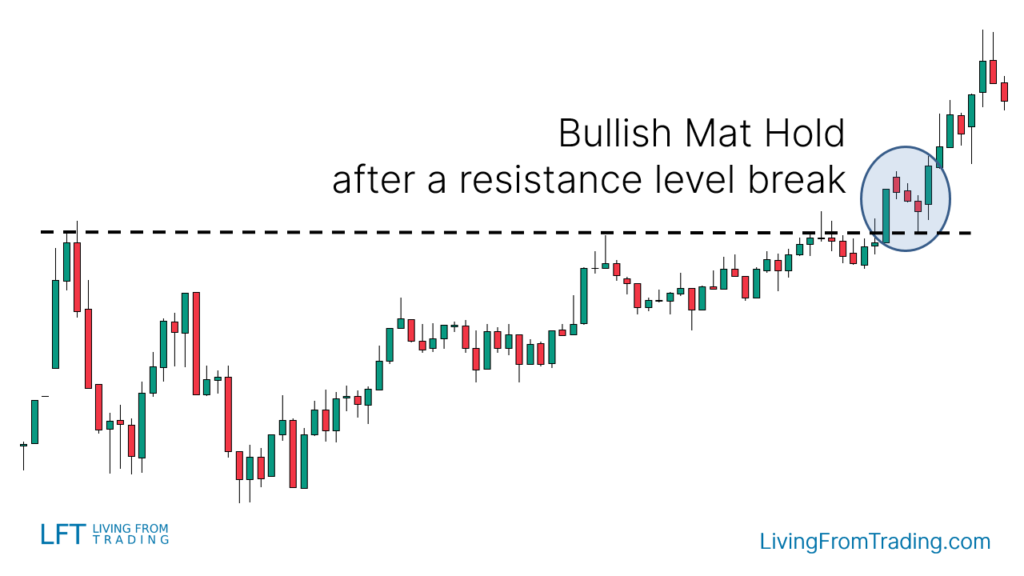
For bullish moves we spot them like this:
- Draw resistance levels on your charts
- Wait for the price to move to the upside hitting the resistance level and breaking it
- After that, you want to see the price coming back to retest the resistance
- Check if a Mat Hold appears at that level
- Go long when the price breaks the high of the last candle of the Mat Hold
- Set your stop loss and take profit levels, and expect a move to the upside
Here’s an example:
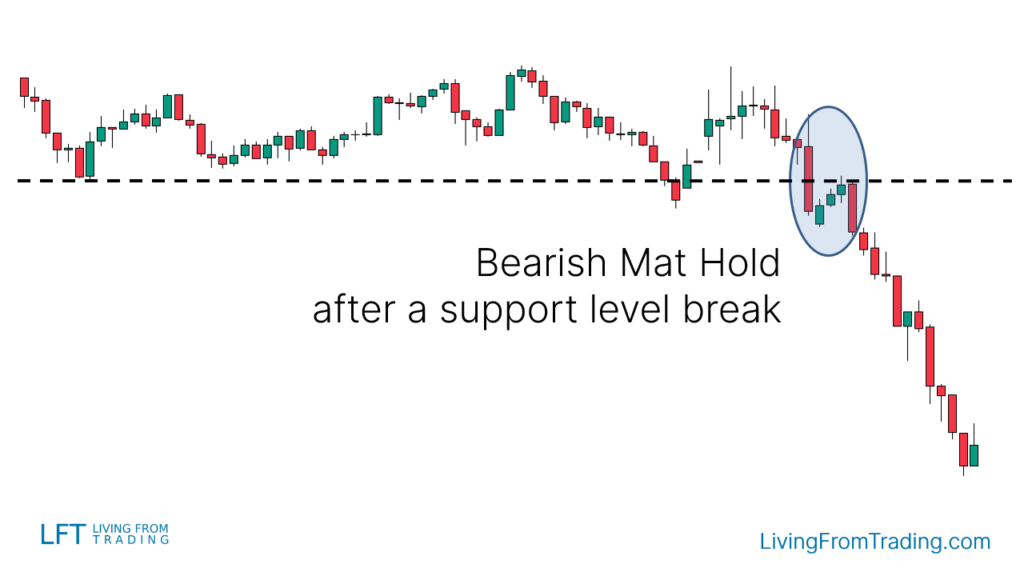
For bearish moves we spot them like this:
- Draw support levels on your charts
- Wait for the price to move to the downside hitting the support level and breaking it
- After that, you want to see the price coming back to retest the support
- Check if a Mat Hold appears at that level
- Short when the price breaks the low of the last candle of the Mat Hold
- Set your stop loss and take profit levels, and expect a move to the downside
Here’s a chart:
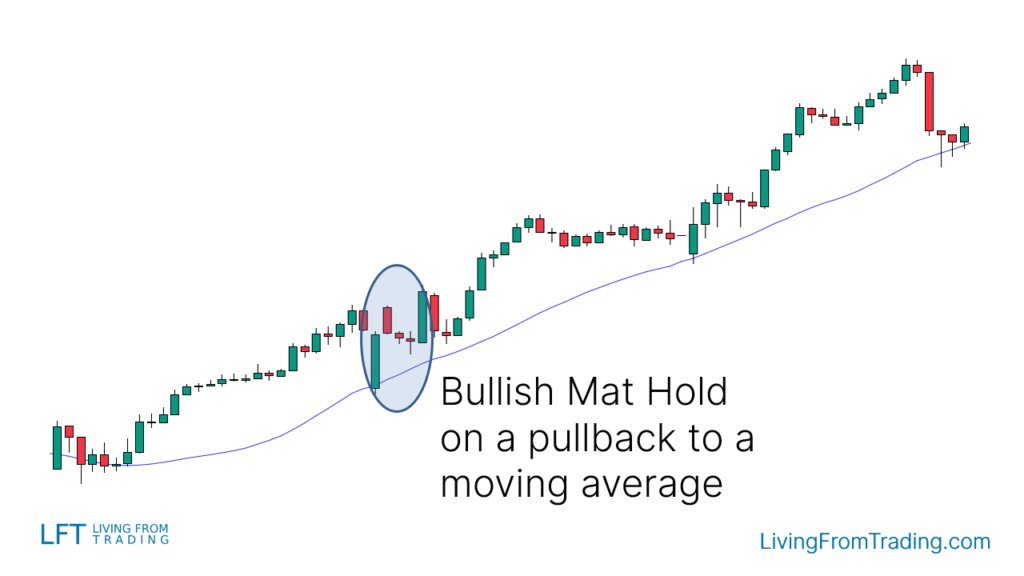
Strategy 3: Trading The Mat Hold With Moving Averages
Moving averages are great trading indicators to trade trends.
The idea here is to trade pullbacks to the moving average when the price is trending.
How does it work for uptrends:
- Find an uptrend, with the price jumping above a moving average
- Wait for a decline in the price to the moving average
- Check if a Mat Hold appears at the moving average
- Go long when the price breaks the high of the last candle of the Mat Hold
- Set your stop loss and take profit levels, and expect another leg to the upside
Like this:
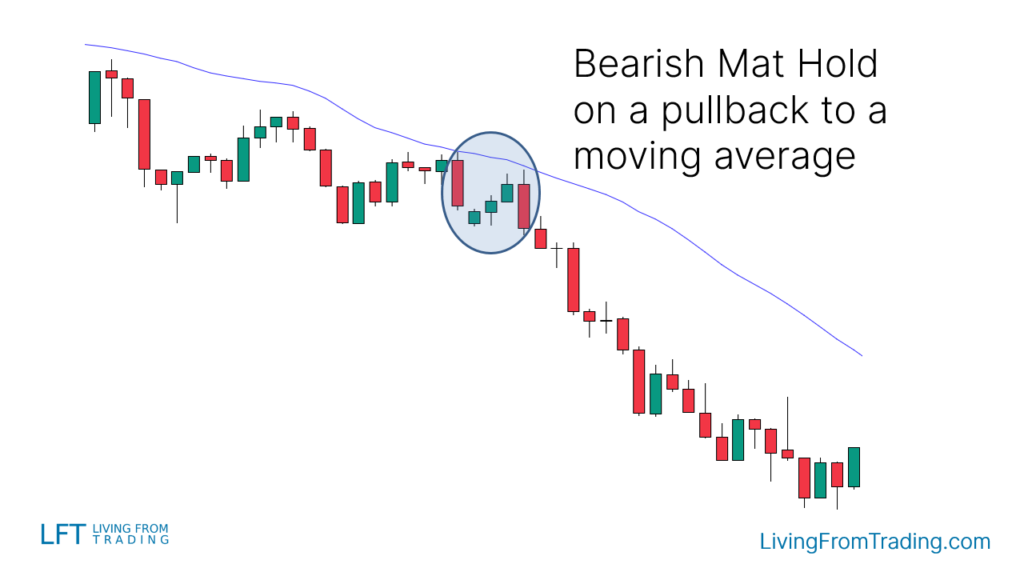
For downtrends you find them like this:
- Find a downtrend, with the price jumping below a moving average
- Wait for the price to go up and hit the moving average
- Check if a Mat Hold appears at the moving average
- Short when the price breaks the low of the last candle of the Mat Hold
- Set your stop loss and take profit levels, and expect another leg to the downside
Example:
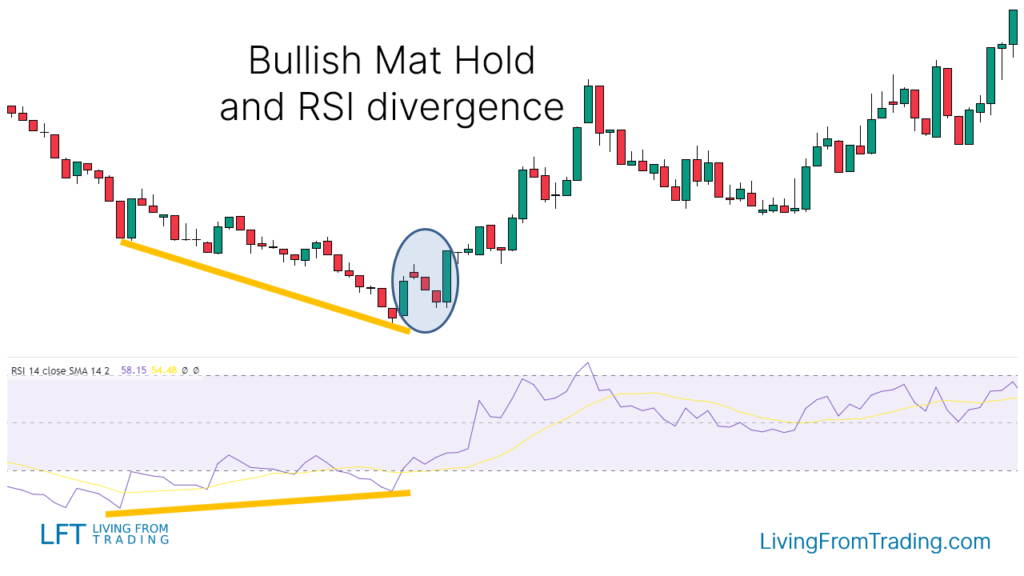
Strategy 4: Trading The Mat Hold With RSI Divergences
This is a bit different from the other trading strategies.
To find a bullish RSI Divergence we want to see the price on a downtrend first, making lower lows and lower highs.
Here’s how it works:
- Find a downtrend
- Mark the lows that the price makes after each leg to the downside
- At the same time compare the price lows with the RSI indicator
- When you see the RSI making higher lows while the price making lower lows, you found your divergence
- Now you wait until a Mat Hold appears at a price lower low, aligned with an RSI higher low.
- Go long when the price breaks the high of the last candle of the Mat Hold
- Set your stop loss and take profit levels, and expect a move to the upside
Like this:
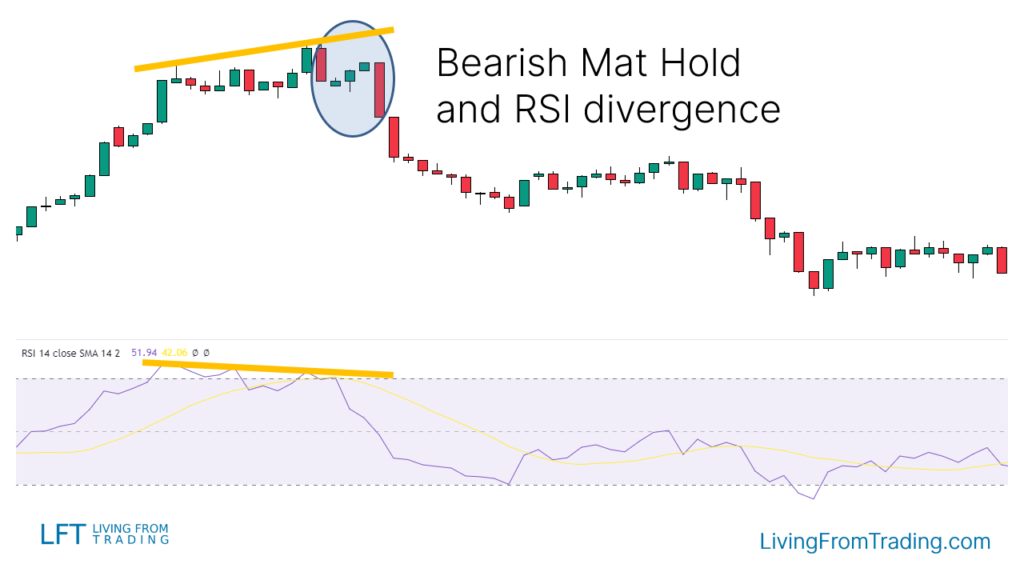
For a bearish divergence, here are the steps:
- Find an uptrend
- Mark the highs that the price makes after each leg to the upside
- At the same time compare the price highs with the RSI indicator
- When you see the RSI making lower highs while the price making higher highs, you found your divergence
- Now you wait until a Mat Hold appears at a price higher high, aligned with an RSI lower high.
- Short when the price breaks the low of the last candle of the Mat Hold
- Set your stop loss and take profit levels, and expect a move to the downside.
It looks like this on a chart:
Strategy 5: Trading The Mat Hold With Fibonacci
Another popular way of trading the Mat Hold candlestick pattern is using the Fibonacci retracement tool.
Fibonacci shows retracement levels where the price will tend to revert frequently.
Depending on the strength of the trend, different levels are more likely to work better with the Mat Hold pattern. Here you can learn more about the different Fibonacci retracement levels.
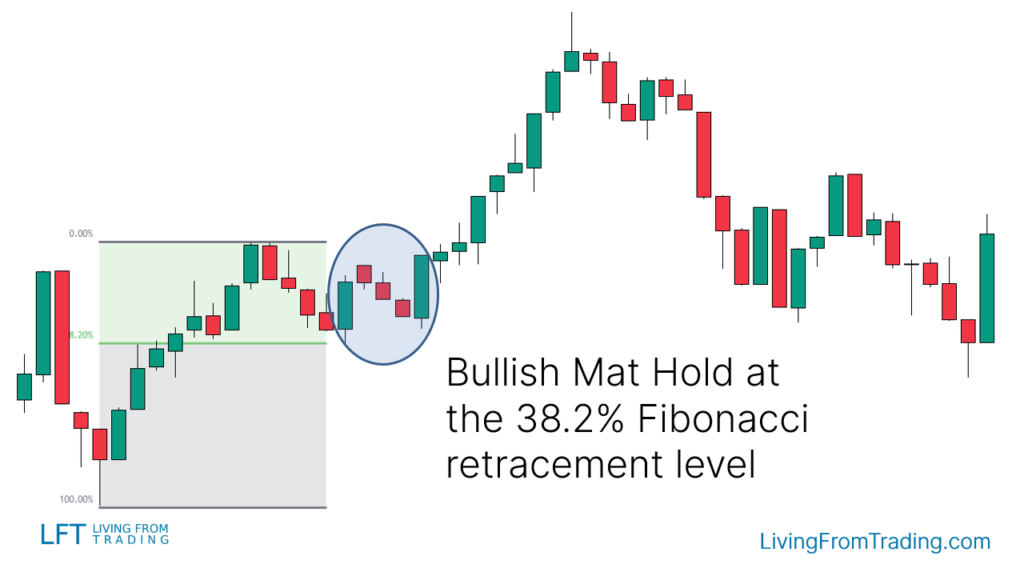
Here’s how the strategy works for a bullish Mat Hold:
- You want to see the price on an uptrend
- Then you wait for a decline, they always happen at some point
- Pick your Fibonacci tool and draw the levels from the low to the high of the move
- When the price hits a Fibonacci level and prints a Mat Hold, that’s what you are waiting for
- Go long when the price breaks the high of the last candle of the Mat Hold
- Set your stop loss and take profit levels, and expect a move to the upside
Here’s an example:
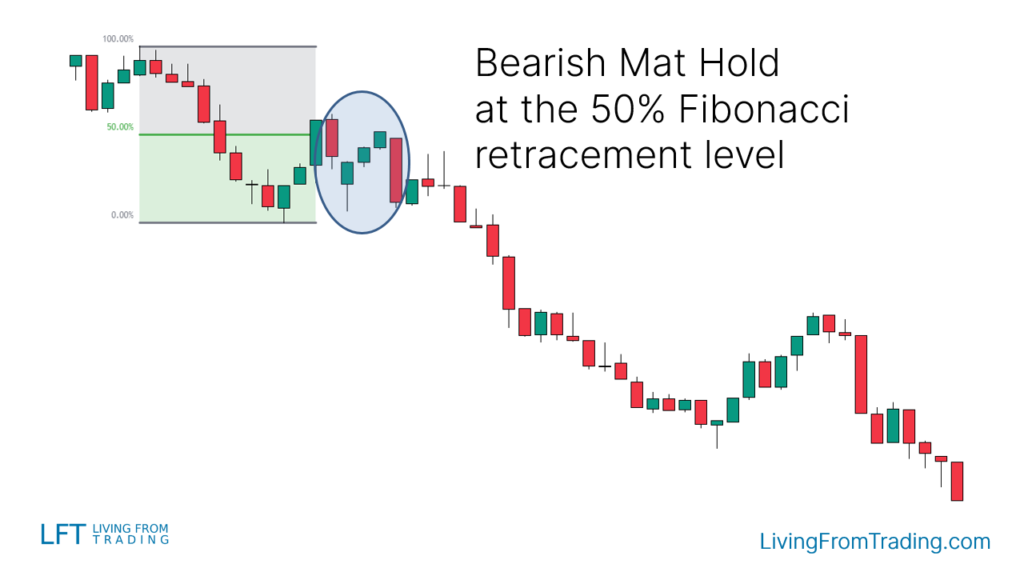
For the bearish Mat Hold version, here are the steps:
- You want to see the price on a downtrend, or at the start of a new one
- Then you wait for a move to the upside, they always happen at some point
- Pick your Fibonacci tool and draw the levels from the high to the low of the move
- When the price hits a Fibonacci level and prints a Mat Hold, that’s what you are waiting for
- Short when the price breaks the low of the last candle of the Mat Hold
- Set your stop loss and take profit levels, and expect a move to the downside
It looks like this:
Strategy 6: Trading The Mat Hold With Pivot Points
Pivot Points are automatic support and resistance levels calculated using math formulas.
If you are day trading, the Daily Pivot Points are the most popular, although the Weekly and Monthly are frequently used too.
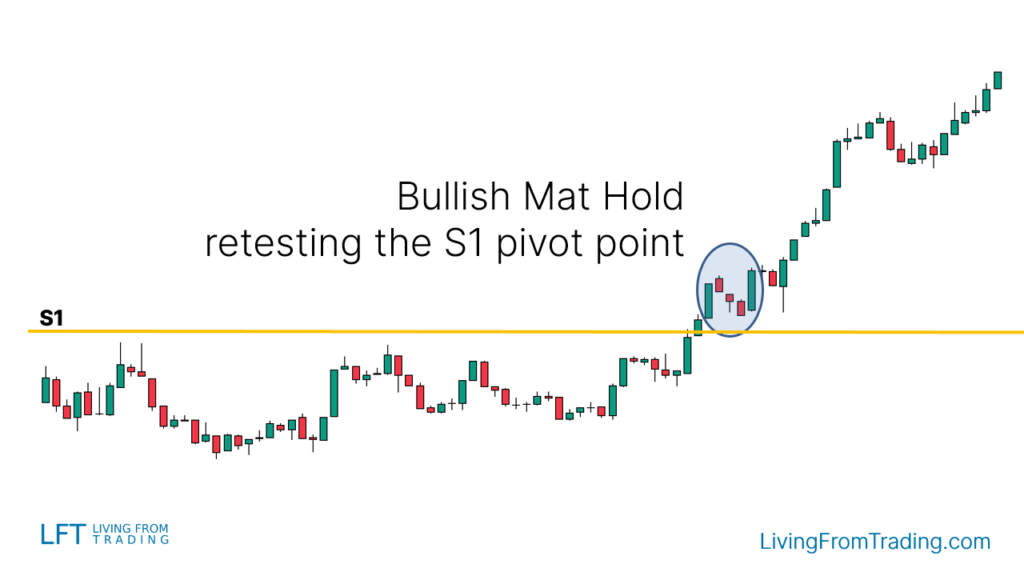
Here’s how to trade the bullish Mat Hold pattern with Pivot Points:
- Activate the Pivot Points indicator on your charts
- Check which Pivot Points are above the price, those will tend to work as a support when broken
- Ideally, you want to see the price on an uptrend
- Wait for a move to the upside to a Pivot Point level and a break
- At that level, you want to see a Mat Hold pattern appearing and retesting the broken level
- Go long when the price breaks the high of the last candle of the Mat Hold
- Set your stop loss and take profit levels, and expect a move to the upside
It looks like this:
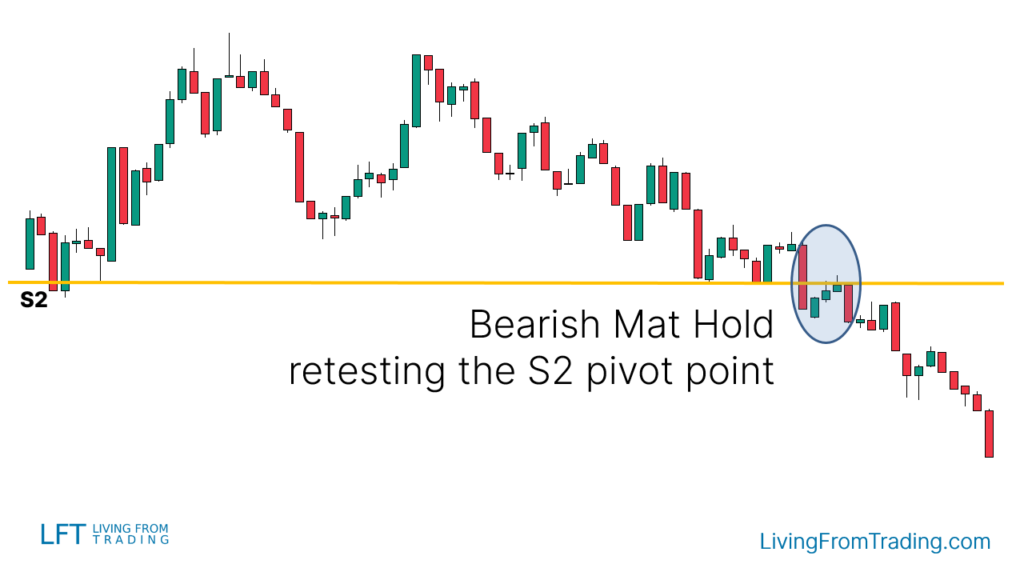
For the bearish Mat Hold, we do it like this:
- Activate the Pivot Points indicator on your charts
- Check which Pivot Points are below the price, those will tend to work as resistances when broken
- Ideally, you want to see the price on a downtrend
- Wait for a price move to the downside to a Pivot Point level and a break
- At that level, you want to see the Mat Hold pattern appearing and retesting the broken pivot point
- Short when the price breaks the low of the last candle of the Mat Hold
- Set your stop loss and take profit levels, and expect a move to the downside
And here’s a chart example:
What Is The Success Rate Of The Mat Hold?
According to the Encyclopedia of Candlestick Charts by Thomas N. Bulkowski (link), the Mat Hold candlestick pattern has a success rate of 78%.
This is what you learned today
- The Mat Hold is a five-candle pattern.
- It has a bullish and a bearish version
- The bullish pattern signs a potential continuation of an uptrend.
- The bearish pattern signs a potential continuation of a downtrend.
- To increase the accuracy, you can trade the Mat Hold using pullbacks, moving averages, and other trading indicators.
- The winning rate of the Mat Hold pattern is 78%.
Now I want to hear from you.
Do you trade the Mat Hold candlestick pattern?
Let me know in the comments below.
Learn More
- List of all candlestick patterns explained