
Most day traders spend their time looking for profitable strategies, holy grails.
But you know what?
Sometimes they are already trading a good strategy.
But they don’t know the basics, they ignore things that are destroying their trading performance.
The Ask and Bid prices, as well as the spread, is something that every trader should know how to handle properly.
You’ll get a hard time putting strategies to work if you don’t understand how to read this information.
But don’t worry.
We’ll get into that right now.
What’s Bid and Ask
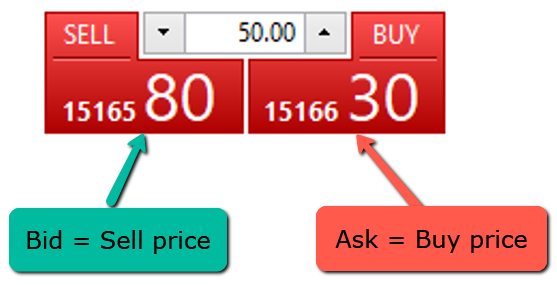
The bid and ask prices are the best prices that someone is willing to buy or sell a certain asset.
This means that:
- If you want to buy, you’ll purchase from the seller that is selling for the lower price (Ask price). This is the same as saying that you buy the ask.
- If you want to sell, you’ll sell to the buyer that is offering the higher price (Bid price). This is the same as saying that you sell the bid.
It’s often shown like this on your charts:
But there’s not just a single bid price or ask price.
In fact, there’s always a cluster of bid prices and a cluster of ask prices.
The bid prices are set by the buyers and are usually under the current market price.
The highest price that a buyer is willing to buy, is called the Bid.
The ask prices are set by the sellers and they are always above the highest bid price.
The lowest price that a seller is willing to sell, is called the Ask.
Look at this example of Dax:
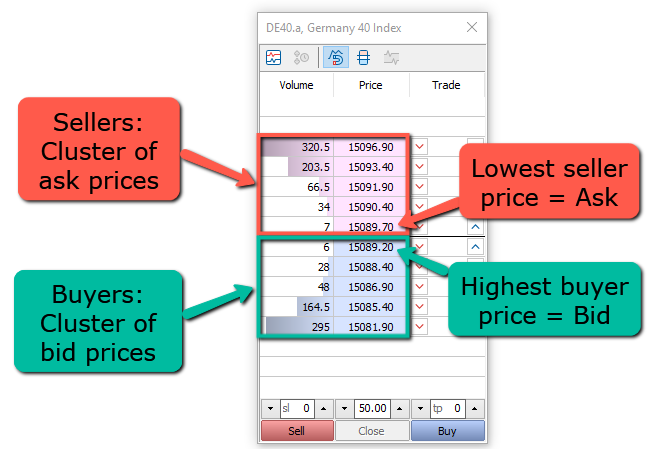
We can see all the ask prices and the best one (lowest) is 15,089.70.
At the bottom, we have the bid prices, being the best one (highest) 15,089.20.
The bid price is often the one that is used to draw the charts on your trading platform.
Meaning that your candles are drawn using the highest price that someone is willing to pay for that asset at a given time.
Sometimes though they are drawn using the last price.
And now you ask…
What’s the Last price?
The last price is the price where the last transaction occurred.
You know, the clusters of bid and ask prices are just pending orders.
They are just there, waiting for a trader to arrive and accept to pay (or sell) for that price.
Until that trader appears and hits the buy or sell button, no transaction is made.
The last transaction price at any particular moment is what’s called the Last price.
How do Bid and Ask affect a stock price
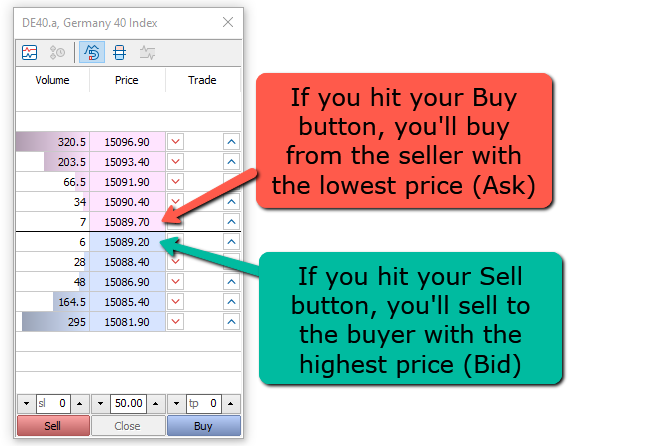
Back to our Dax example, we saw that the Ask price was 15,089.70.
(Well, I know it’s not a stock, but the concept is exactly the same).
Do you want to buy Dax now?
Let’s say that you think it’s going up and you hit your buy button.
Your order will be executed at 15,089.70.
That’s where the seller with the lowest price is waiting for someone to buy from him.
On the other hand, if you hit your sell button, your order will be executed at 15,089.20.
That’s where the buyer with the highest price is waiting for someone to sell to him.
Every time that someone makes a transaction, the Last price will update to the price where the transaction was made.
Makes sense?
Great!
Now, look at the left column, we have the volume.
That’s how big are the pending orders there, and how much are buyers and sellers willing to buy or sell at each level.
When a level drains out of limit orders, the market goes to the next level.
In our example, we have the Bid price with a volume of 6 and the next level below with a volume of 28.
Let’s say that you hit your sell button with a volume of 10.
Your order will be executed at different levels.
6 will be executed at the 1st level.
And the remaining 4 will be executed at the next level below.
Meaning that the current price will move down one tick.
Congratulations, you just made the price move!
Feels good?
Now, one thing that you always want to be careful of is about the spread.
What’s the spread?
The spread is the price difference between the Bid price and the Ask price.
Look at this example, the Bid price is 15165.80 while the Ask price is 15166.30.
If we calculate the difference between both Bid and Ask prices we get the spread, which is 0.50 in this case.
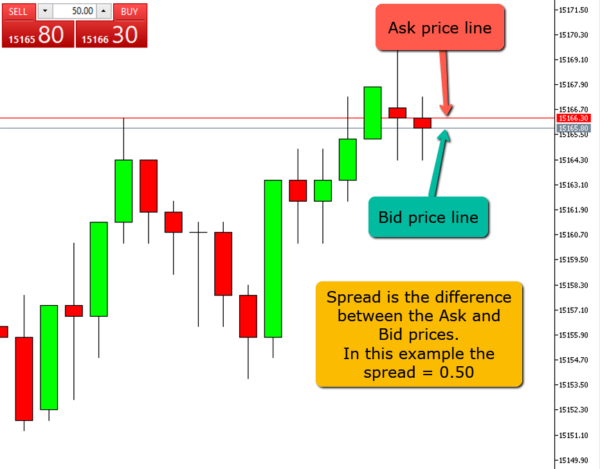
Now you can visually see on your trading monitor where your orders are going to open.
If you hit your buy button, the trade will open at the red line, Ask line.
If you hit your sell button, the trade will open at the gray line, Bid line.
Why is the spread important?
If you’re not aware of the spread you may ruin a trade completely.
There are some times of the day when the market you’re trading may not be moving much.
Or maybe you’re trading a stock with low liquidity.
In both of these cases, the spread may be huge.
And I mean really, really big.
Look at this example with a big spread.
If you click your buy button, your trade will open way above the current price, right at that red line.
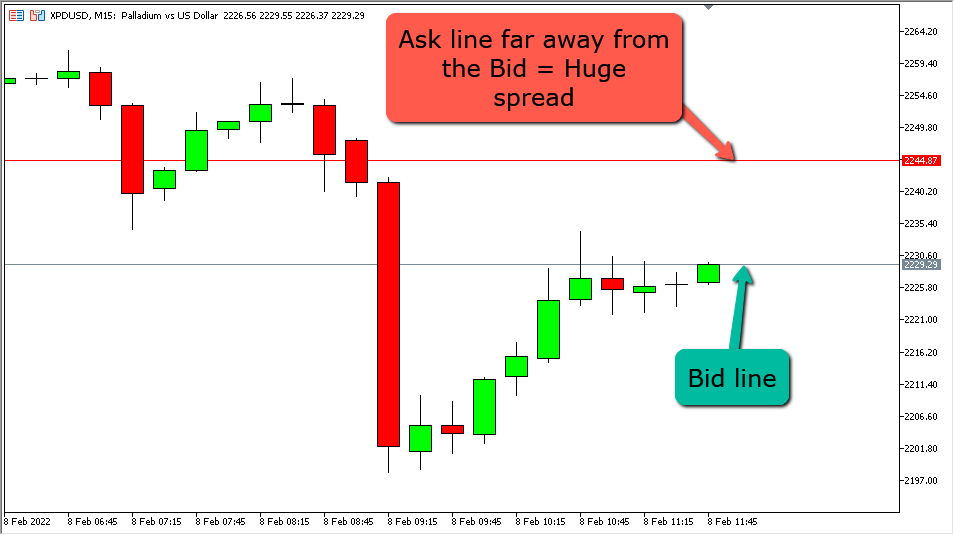
Do you understand how big the move needs to be before you get into profitable territory?
If you buy there, you only start to get profit after the price crosses the red line!
This will dramatically reduce your odds of success.
That’s not how day traders make money.
And even worse…
Your stop loss will need to be huge.
And you don’t want to trade with these kinds of conditions.
Solutions?
Avoid trading, specially day trading or scalping, when the major sessions are closed.
When trading stocks, specially low-cap stocks, always watch the bid and ask and understand how big is the spread.
If you really want to trade that particular market, you’ll be better off using a limit pending order instead of a market order.
Why is Bid and Ask higher than the stock price
Often the Bid and Ask prices can be on different levels than the Last price.
There are two main scenarios where this can happen.
Scenario #1 – On Daily gaps
Stocks are closed for a long time compared to other markets like Forex, Futures, or Cryptos.
While a market is closed a lot of things can happen that can change the trader’s mind.
News releases are an example.
Good news may make traders be willing to pay higher prices.
Bad news may make traders more bearish.
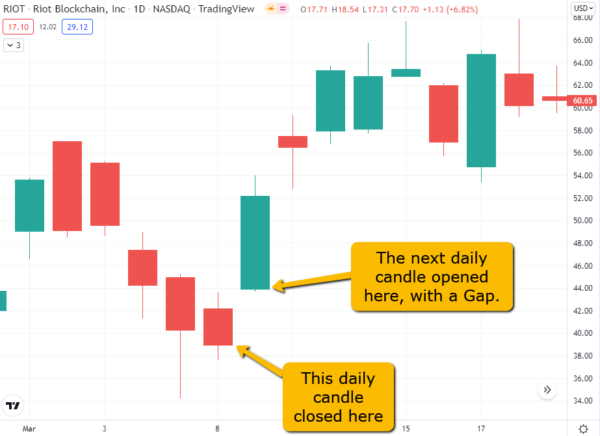
For this reason, it’s common to find big gaps in stock daily candles.
The price closes at a particular level in one day.
And it opens at a different level on the next day, either above or below the previous price.
Here’s an example of what it looks like on your charts:
Scenario #2 – On low-liquidity stocks
There are stocks that are so unliquid, that have so few people trading them that the price may just tick a few times per day.
Often these trades may be just market makers trading against themselves.
If your charts are drawn using the Last price, you’ll often find gaps between the last trade price and the current bid and ask in these kinds of stocks.
The key here is not to learn how to trade these stocks.
You don’t want to trade something that no one is trading!
What is important is to identify them so that you can ignore them and focus on stocks that are moving.
Here’s what you learned today
- The Bid price is the best price that buyers are willing to pay. That’s the price that you get when you hit your sell button.
- The Ask price is the best price that sellers are willing to sell. That’s the price that you get when you hit your buy button.
- The Last price is the price where the last transaction was made.
- The price moves when the liquidity/volume from the current Bid or Ask levels is completely removed.
- The spread is the distance between the Bid and Ask prices. You should always be aware of the size of the spread to avoid getting into trouble.
Now I want to hear from you.
Have you ever gotten into trouble because of high spreads?
Tell me your experiences below in the comments.