
Financial markets are full of traps and traders keep falling on them over and over.
One of the most famous is the Bull Trap.
Although it’s so simple to identify, traders keep letting their emotions control them.
But it doesn’t need to be like that.
Let’s see how to take advantage of the Bull Trap, taking trades to profit from trapped traders.
What is a Bull Trap?
As the name states, a Bull Trap is a chart pattern that traps bull traders.
You know, bull traders follow an uptrend.
But a trend doesn’t last forever.
At some point, the trend will end or at least make a bigger correction than just a small pullback.
And that’s exactly where the bull traders tend to get caught.
Here’s what it looks like in your charts:
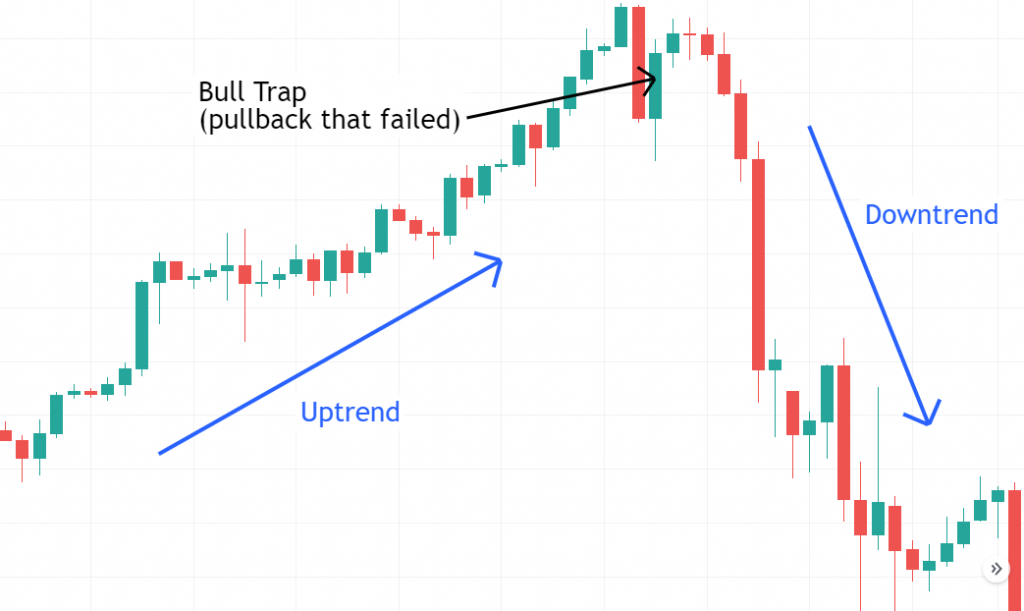
Bull traders are taking advantage of an uptrend.
They load their position when the price retraces to a lower level.
And they take profits as the price makes a new rally and hits new highs.
But at some point, a pullback fails, and the price starts a downtrend.
They get trapped!
This pattern can also be frequently found when a pump and dump scheme is about to start failing.
So, where do we find these bull traps?
Let’s look at the top locations.
Top locations to find a Bull Trap
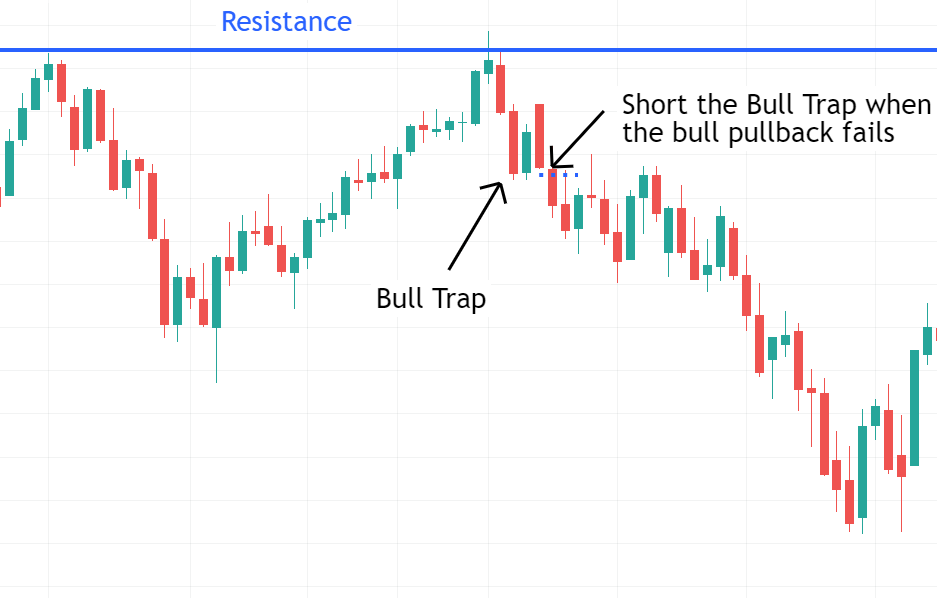
Location #1 – At resistance levels
Resistances are classic places where the price trend tends to change very often.
For this reason, when we are taking a trade against a resistance we are asking for trouble.
Look at this example of a Bull Trap pattern right at a resistance level.
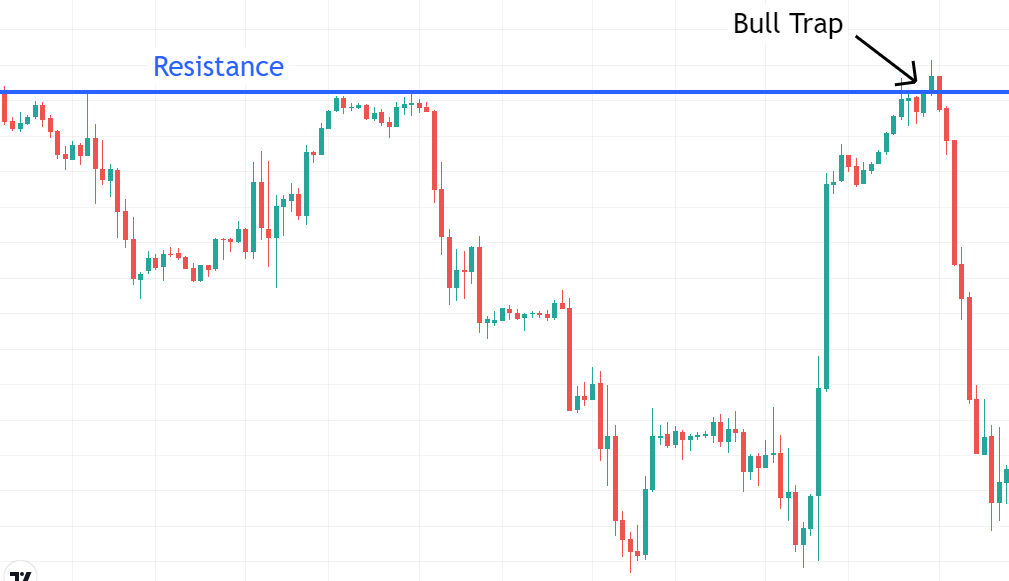
Do you see how the price had trouble passing that zone in the past?
That means that there are a lot of sellers there.
And that’s also why we call that zone a resistance.
When the price reaches that location again, those sellers are there waiting for you.
When bull traders take the pullback expecting a continuation of the up move, they are instantly destroyed.
Location #2 – After a strong drop
Strong, violent drops, after a big move to the upside, are a sign of a lot of selling pressure.
Good trading is nothing more than following the market strength.
And how can you see that strength?
Just looking at the candles.
Look at this bull trap example:
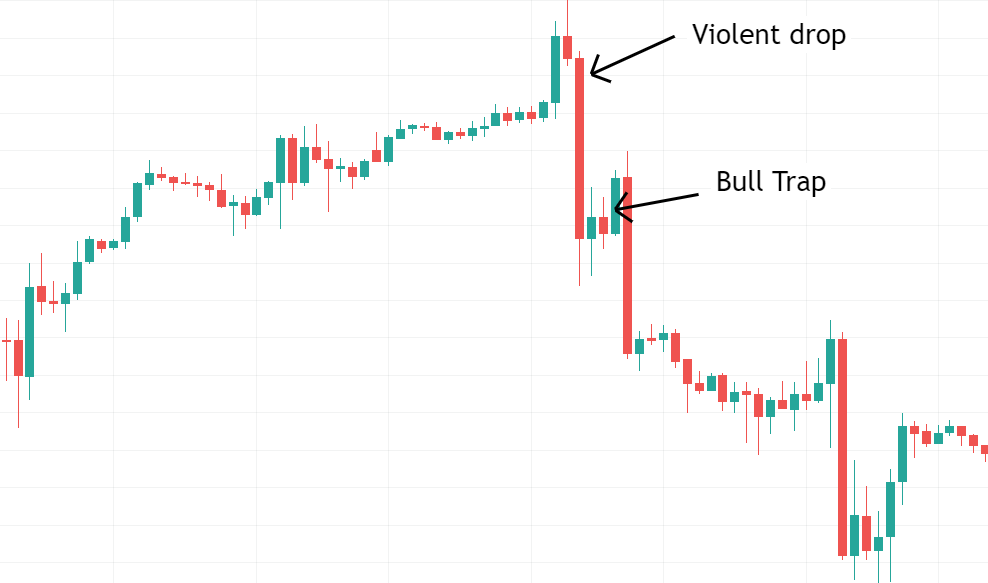
The price was moving on an uptrend.
At some point, a violent drop appeared on the charts.
That big fat red candle.
Often called an ignition bar.
Right after a top.
That was a huge train that just went against the uptrend.
Would you try to go against this train’s strength?
Or would you rather catch the train and profit from the next moves that will blast everything?
The last one I suppose.
For this reason, the next pullback after a big drop is not a buyable pullback.
More often than not it will tend to fail.
And traders that try to get it…
Will very likely get trapped once again!
Location #3 – Far away from moving averages
Moving averages are my favorite indicator to read the markets.
They act as elastics.
When the price comes and hits them, they resist and push the price back again.
As the price gets further away from the moving average, it loses strength and falls back to the moving average again.
And then the process repeats over and over.
So, what’s the best place to take a trade using moving averages?
Exactly when the price is rebounding, touching the moving average, and getting ready for a new leg.
Now, you tell me…
What should you do if you saw a pullback appearing far away from a moving average?
Nothing!
We want to catch the price close to the moving average.
If it’s still far away it’s more likely that it will come back to the moving average before it makes another move.
This is what this bull trap looks like in your charts:
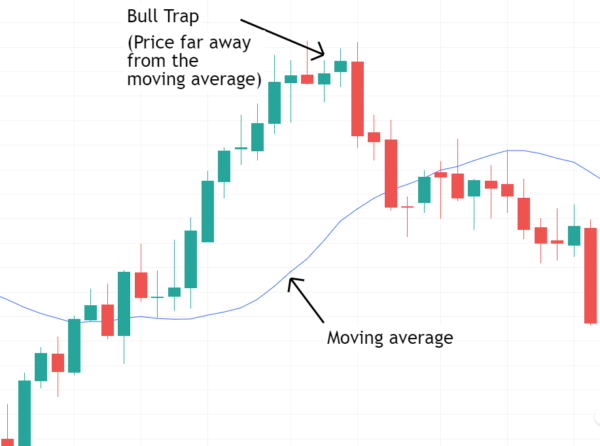
Did you see that pullback appearing far away from the moving average?
That’s a pattern that will fail more often than not.
That’s a trap, a bull trap.
And you don’t want to get caught buying there.
On which time frames can I find bull traps?
Bull traps appear on any time frame.
Time frames work as fractals.
The same patterns and movements appear whether you are on a Weekly time frame or the 1-minute time frame. It doesn’t matter if you’re investing or trading, you should be aware of these traps always.
It’s just the scale that is different.
Whether you are a day trading, scalping, or swing trading, you’ll see those bull traps appearing over and over again.
Bull Trap vs Bear Trap
A bear trap is exactly the same as a bull trap.
The only difference is that it’s formed upside down.
While a bull trap appears during an uptrend.
A bear trap will appear at the end of a downtrend.
Here’s an example of a bear trap:
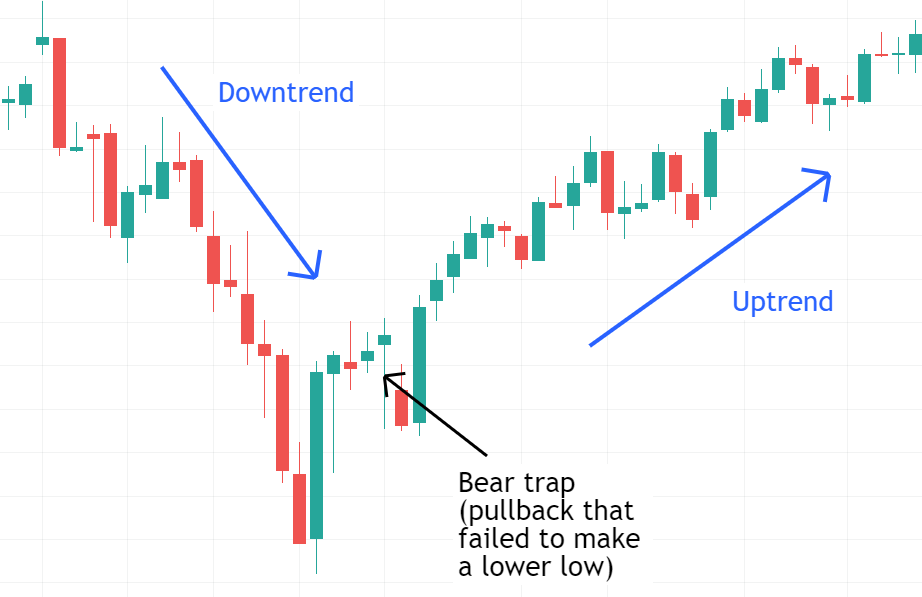
Remember the violent reactions?
It happened here again.
The price was on a downtrend, a violent reaction appeared and the next pullback failed.
Bear traders that took that one, are now trapped and getting losses.
How to trade the Bull Trap?
The bull trap is a price failure to continue an uptrend.
If an uptrend is failing, what do we want to focus on?
Shorting!
Here are the steps to trade the bull trap:
Step 1: Wait for the price to meet conditions where a trend change may happen.
This may be at resistances, far away from moving averages, or after a violent reaction against the trend.
The head and shoulders pattern is also a variation of a bull trap.
Step 2: Wait for the next pullback to form.
Bull traders will enter here, waiting for a new high.
But we don’t, we are waiting for them to get trapped.
Step 3: Wait for the pullback to fail or start failing.
Here we can choose.
As an aggressive trader, you can short immediately when the price stalls after the pullback forms and starts to come down.
As a conservative trader, you can wait for the price to break the bull trap pullback to the downside and then short the next pullback.
Here’s an example of an aggressive entry on a Bull trap:
Why does the price go down after a Bull Trap?
There are two main reasons.
Reason #1: A lot of short-sellers already entered the market.
They are pushing the price down.
That’s why we often see violent reactions to the downside.
Makes sense?
Next…
Reason #2: The bull traders start to close their trades.
When you close a long trade, you are selling to the market.
As the price goes against the bull traders, their stop losses start to be hit.
That increases the selling pressure on the market.
And where does this stop?
Well, at least until the market gets rid of these sellers.
The ones shorting and making profits, or the ones closing their long trades with losses…
While they are actively doing those actions the price will tend to keep dropping.
Let’s recap what you learned today
- A bull trap is a chart pattern that often appears at the end of an uptrend.
- The best locations to find them are at resistances when the price is far away from moving averages, or after violent drops.
- Bull traps can be found in any time frame and any market.
- A bull trap is an opportunity to short and get advantage of the selling pressure that trapped bull traders will add to the market when closing their losses.
Now I want to hear from you.
Do you ever trade Bull Traps? How do you do it?
Let me know below in the comments.